EX-99.2
Published on July 16, 2025
Exhibit 99.2
Table of Contents.
|
||||||||
| Section | Page | ||||
| Corporate Data: | |||||
| Consolidated Financial Results: | |||||
| Portfolio Data: | |||||
Disclosures:
Forward-Looking Statements: This supplemental package contains “forward-looking statements” within the meaning of the Private Securities Litigation Reform Act of 1995. We caution investors that any forward-looking statements presented herein are based on management’s beliefs and assumptions and information currently available to management. Such statements are subject to risks, uncertainties and assumptions and may be affected by known and unknown risks, trends, uncertainties and factors that are beyond our control. Should one or more of these risks or uncertainties materialize, or should underlying assumptions prove incorrect, actual results may vary materially from those anticipated, estimated or projected. These risks and uncertainties include, without limitation: general risks affecting the real estate industry (including, without limitation, the market value of our properties, the inability to enter into or renew leases at favorable rates, portfolio occupancy varying from our expectations, dependence on tenants’ financial condition, and competition from other developers, owners and operators of real estate); risks associated with the disruption of credit markets or a global economic slowdown; risks associated with the potential loss of key personnel (most importantly, members of senior management); risks associated with our failure to maintain our status as a Real Estate Investment Trust under the Internal Revenue Code of 1986, as amended; possible adverse changes in tax and environmental laws; an epidemic or pandemic (such as the outbreak and worldwide spread of novel coronavirus (COVID-19), and the measures that international, federal, state and local governments, agencies, law enforcement and/or health authorities may implement to address it, which may (as with COVID-19) precipitate or exacerbate one or more of the above-mentioned factors and/or other risks, and significantly disrupt or prevent us from operating our business in the ordinary course for an extended period; litigation, including costs associated with prosecuting or defending pending or threatened claims and any adverse outcomes, and potential liability for uninsured losses and environmental contamination.
For a further discussion of these and other factors that could cause our future results to differ materially from any forward-looking statements, see Item 1A. Risk Factors in our 2024 Annual Report on Form 10-K, which was filed with the Securities and Exchange Commission (“SEC”) on February 10, 2025, and other risks described in documents we subsequently file from time to time with the SEC. We disclaim any obligation to publicly update or revise any forward-looking statement to reflect changes in underlying assumptions or factors, of new information, data or methods, future events or other changes.
Our credit ratings, which are disclosed on page 4, may not reflect the potential impact of risks relating to the structure or trading of the Company's securities and are provided solely for informational purposes. Credit ratings are not recommendations to buy, sell or hold any security, and may be revised or withdrawn at any time by the issuing organization in its sole discretion. The Company does not undertake any obligation to maintain the ratings or to advise of any change in ratings. Each agency's rating should be evaluated independently of any other agency's rating. An explanation of the significance of the ratings may be obtained from each of the rating agencies.
|
Second Quarter 2025
Supplemental Financial Reporting Package
|
Page 2
|

|
||||||
Investor Company Summary.
|
||||||||
| Executive Management Team | ||||||||
| Howard Schwimmer | Co-Chief Executive Officer, Director | |||||||
| Michael S. Frankel | Co-Chief Executive Officer, Director | |||||||
| Laura Clark | Chief Operating Officer | |||||||
| Michael Fitzmaurice | Chief Financial Officer | |||||||
David E. Lanzer |
General Counsel and Corporate Secretary | |||||||
| Board of Directors | ||||||||
| Tyler H. Rose | Chairman |
|||||||
| Howard Schwimmer | Co-Chief Executive Officer, Director | |||||||
| Michael S. Frankel | Co-Chief Executive Officer, Director | |||||||
| Robert L. Antin | Director | |||||||
| Diana J. Ingram | Director | |||||||
| Angela L. Kleiman | Director | |||||||
| Debra L. Morris | Director | |||||||
| Investor Relations Information | ||||||||
Mikayla Lynch | ||||||||
Director, Investor Relations and Capital Markets |
||||||||
mlynch@rexfordindustrial.com | ||||||||
| Equity Research Coverage | ||||||||||||||||||||||||||||||||
| BofA Securities | Samir Khanal |
(646) 855-1497 |
J.P. Morgan Securities | Michael Mueller | (212) 622-6689 | |||||||||||||||||||||||||||
| Barclays | Brendan Lynch | (212) 526-9428 | Jefferies LLC | Jonathan Petersen | (212) 284-1705 | |||||||||||||||||||||||||||
| BMO Capital Markets | John Kim | (212) 885-4115 | Mizuho Securities USA | Vikram Malhotra | (212) 282-3827 | |||||||||||||||||||||||||||
| BNP Paribas Exane | Nate Crossett | (646) 342-1588 | Robert W. Baird & Co. | Nicholas Thillman | (414) 298-5053 | |||||||||||||||||||||||||||
| Citigroup Investment Research | Craig Mailman | (212) 816-4471 | Scotiabank | Greg McGinniss | (212) 225-6906 | |||||||||||||||||||||||||||
| Colliers Securities | Barry Oxford | (203) 961-6573 | Truist Securities | Anthony Hau | (212) 303-4176 | |||||||||||||||||||||||||||
Deutsche Bank |
Omotayo Okusanya | (212) 250-9284 |
Wedbush Securities | Richard Anderson | (212) 931-7001 | |||||||||||||||||||||||||||
Evercore ISI |
Steve Sakwa | (212) 446-9462 | Wells Fargo Securities | Blaine Heck | (443) 263-6529 | |||||||||||||||||||||||||||
| Green Street Advisors | Vince Tibone | (949) 640-8780 | Wolfe Research | Andrew Rosivach | (646) 582-9250 | |||||||||||||||||||||||||||
Disclaimer: This list may not be complete and is subject to change as firms add or delete coverage of our company. Please note that any opinions, estimates, forecasts or predictions regarding our historical or predicted performance made by these analysts are theirs alone and do not represent opinions, estimates, forecasts or predictions of Rexford Industrial Realty, Inc. or its management. We are providing this listing as a service to our stockholders and do not by listing these firms imply our endorsement of, or concurrence with, such information, conclusions or recommendations. Interested persons may obtain copies of analysts’ reports on their own; we do not distribute these reports.
|
Second Quarter 2025
Supplemental Financial Reporting Package
|
Page 3
|
|
||||||
Company Overview.
|
||||||||
| For the Quarter Ended June 30, 2025 | ||||||||
|
Second Quarter 2025
Supplemental Financial Reporting Package
|
Page 4
|
|
||||||
Highlights - Consolidated Financial Results.
|
||||||||
| Quarterly Results | (in millions) | |||||||
|
Second Quarter 2025
Supplemental Financial Reporting Package
|
Page 5
|
|
||||||
Financial and Portfolio Highlights and Capitalization Data.(1)
|
||||||||
| (in thousands except share and per share data and portfolio statistics) | ||||||||
| Three Months Ended | |||||||||||||||||||||||||||||
| June 30, 2025 | March 31, 2025 | December 31, 2024 | September 30, 2024 | June 30, 2024 | |||||||||||||||||||||||||
| Financial Results: | |||||||||||||||||||||||||||||
| Total rental income | $ | 241,568 | $ | 248,821 | $ | 239,737 | $ | 238,396 | $ | 232,973 | |||||||||||||||||||
| Net income | $ | 120,394 | $ | 74,048 | $ | 64,910 | $ | 70,722 | $ | 86,017 | |||||||||||||||||||
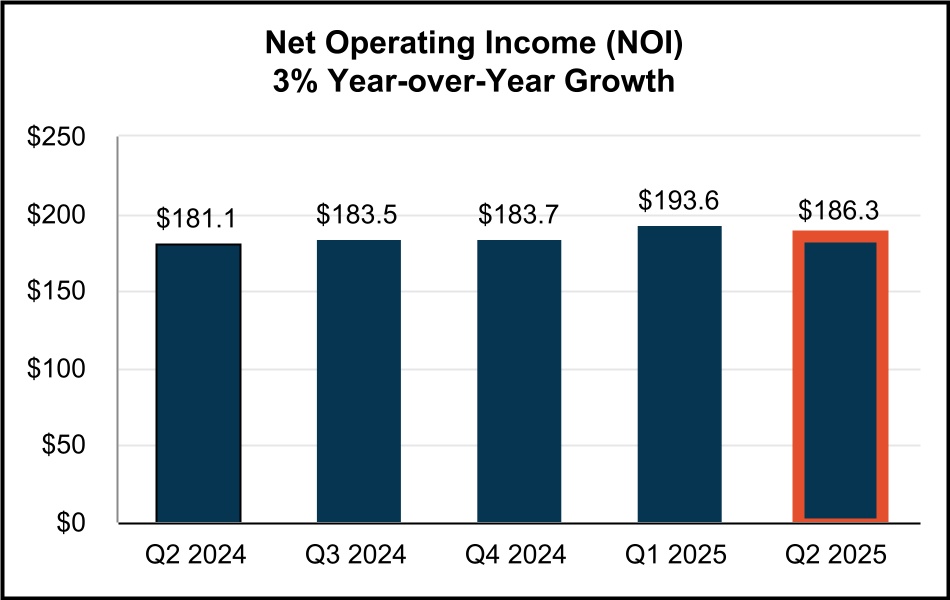
| Net Operating Income (NOI) | $ | 186,270 | $ | 193,560 | $ | 183,731 | $ | 183,529 | $ | 181,068 | |||||||||||||||||||
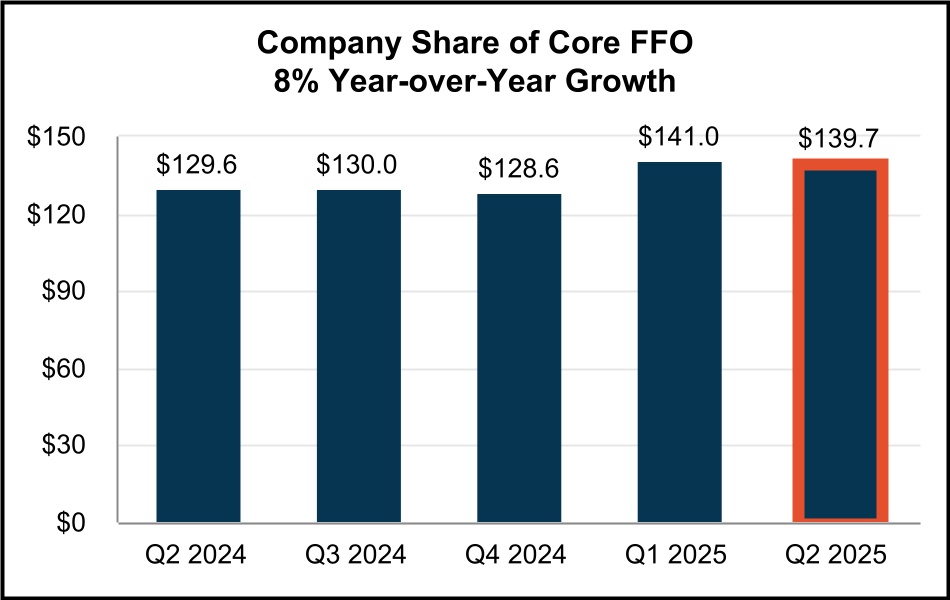
| Company share of Core FFO | $ | 139,709 | $ | 141,023 | $ | 128,562 | $ | 130,011 | $ | 129,575 | |||||||||||||||||||
| Company share of Core FFO per common share - diluted | $ | 0.59 | $ | 0.62 | $ | 0.58 | $ | 0.59 | $ | 0.60 | |||||||||||||||||||
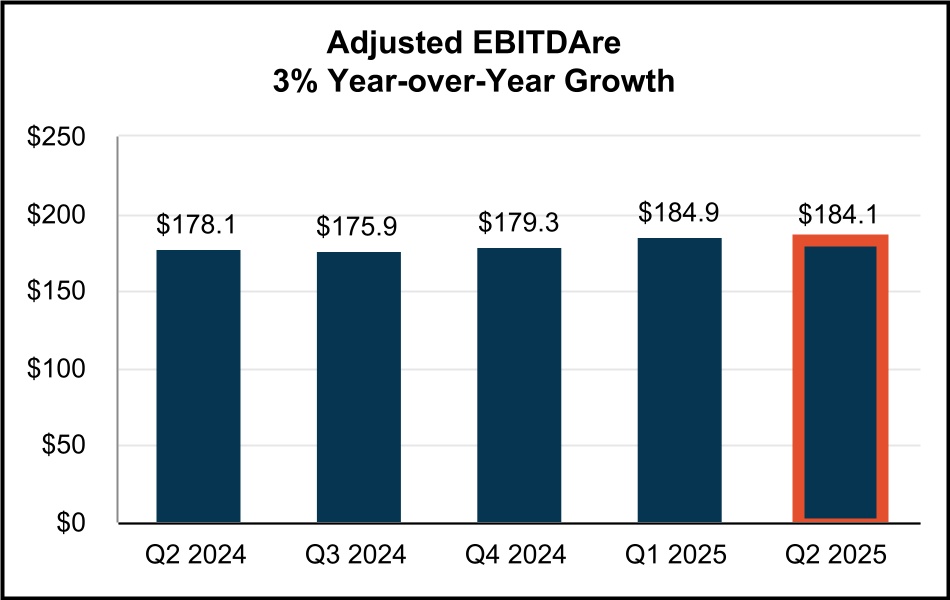
Adjusted EBITDAre
|
$ | 184,111 | $ | 184,859 | $ | 179,347 | $ | 175,929 | $ | 178,106 | |||||||||||||||||||
| Dividend declared per common share | $ | 0.4300 | $ | 0.4300 | $ | 0.4175 | $ | 0.4175 | $ | 0.4175 | |||||||||||||||||||
| Portfolio Statistics: | |||||||||||||||||||||||||||||
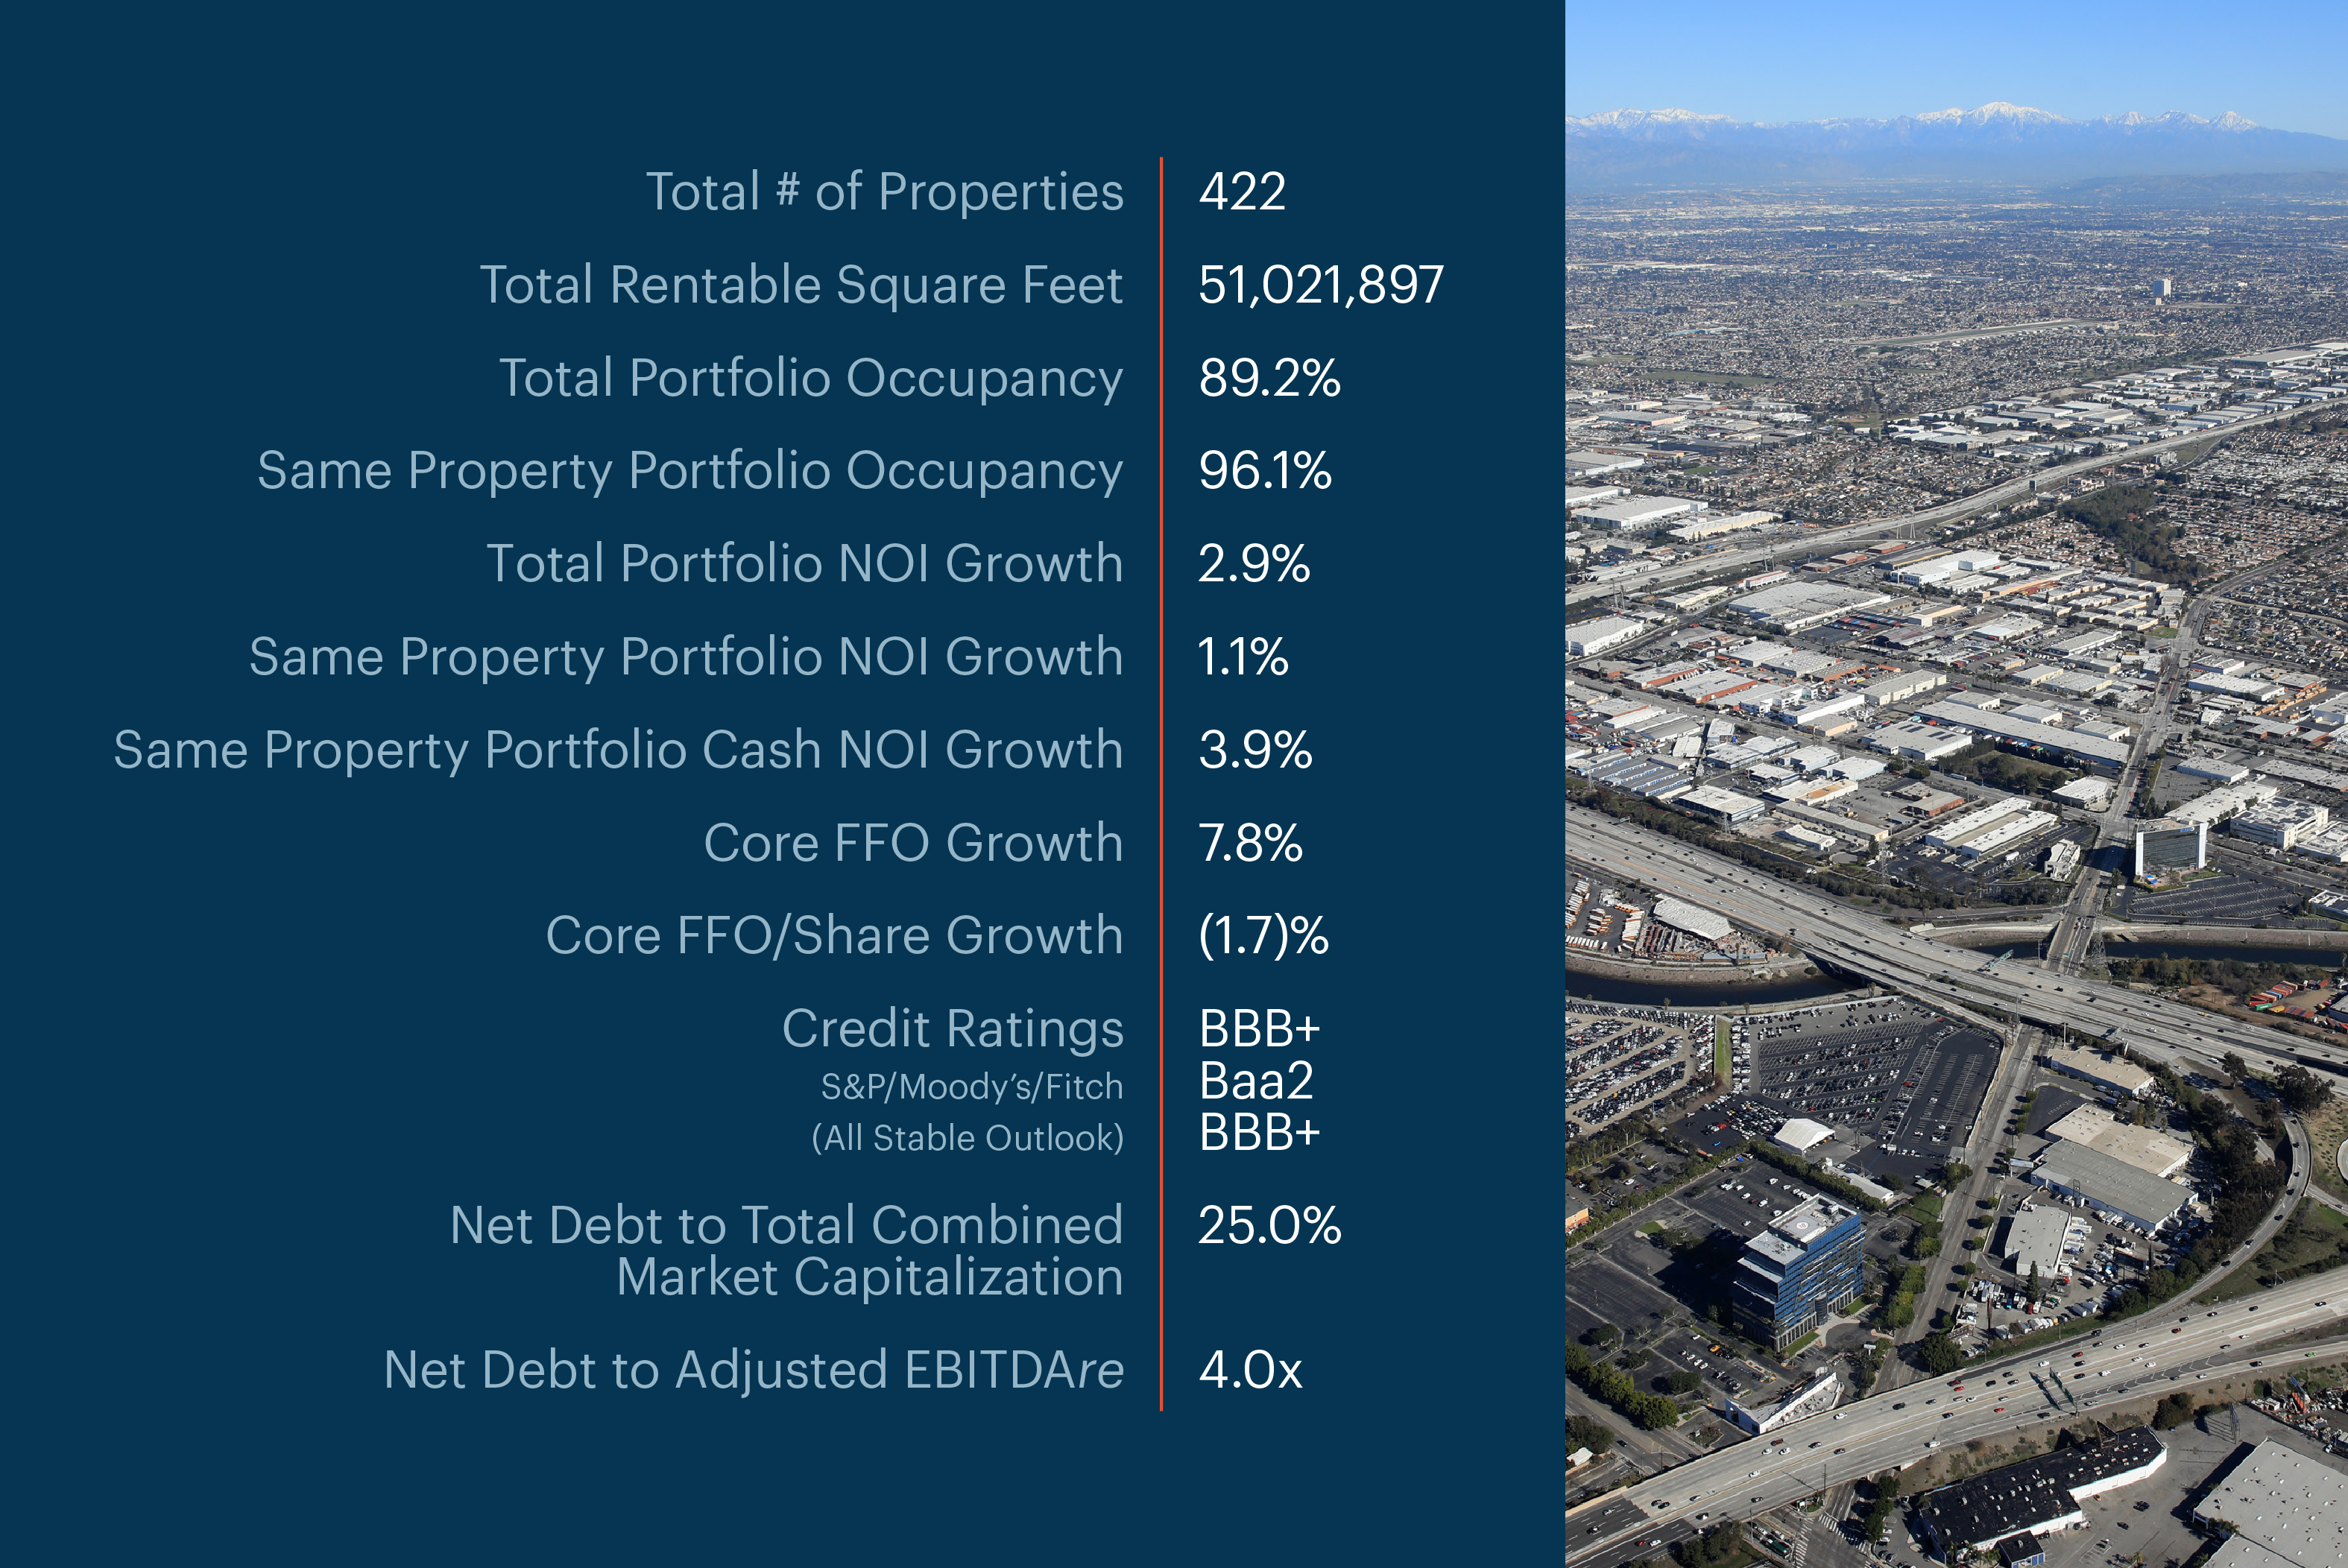
| Portfolio rentable square feet (“RSF”) | 51,021,897 | 50,952,137 | 50,788,225 | 50,067,981 | 49,710,628 | ||||||||||||||||||||||||
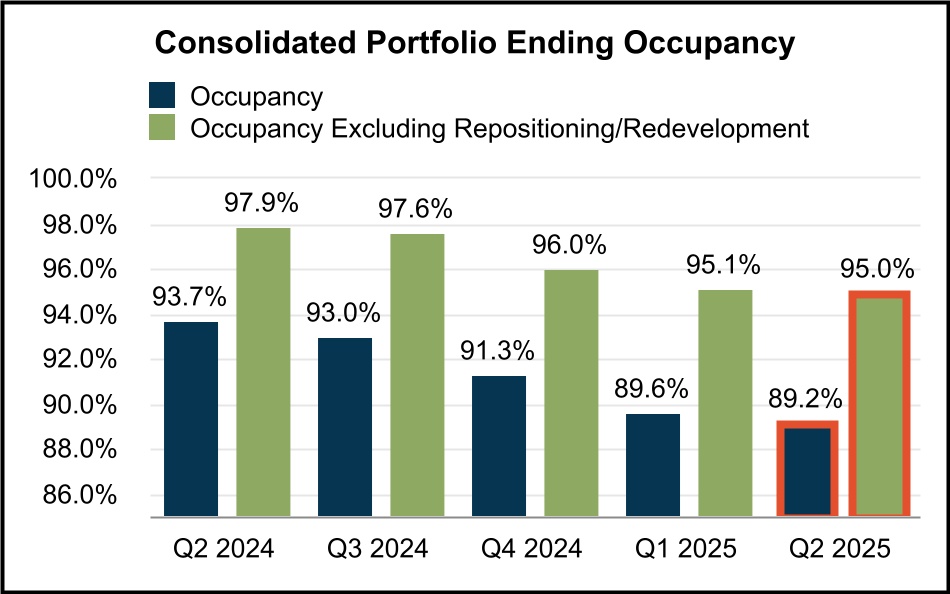
| Ending occupancy | 89.2% | 89.6% | 91.3% | 93.0% | 93.7% | ||||||||||||||||||||||||
Ending occupancy excluding repositioning/redevelopment(2)
|
95.0% | 95.1% | 96.0% | 97.6% | 97.9% | ||||||||||||||||||||||||
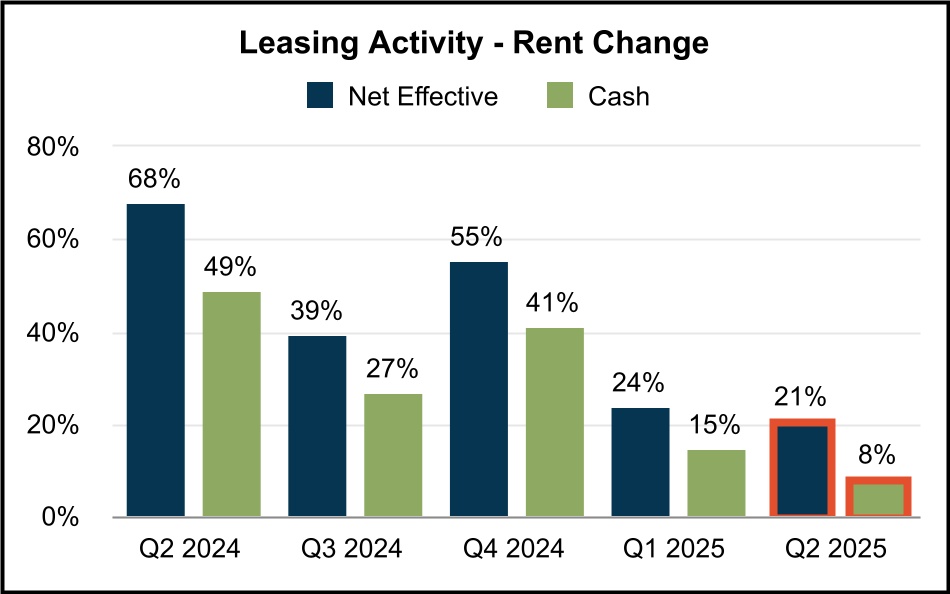
| Net Effective Rent Change | 20.9% | 23.8% | 55.4% | 39.2% | 67.7% | ||||||||||||||||||||||||
| Cash Rent Change | 8.1% | 14.7% | 41.0% | 26.7% | 49.0% | ||||||||||||||||||||||||
| Same Property Portfolio Performance: | |||||||||||||||||||||||||||||
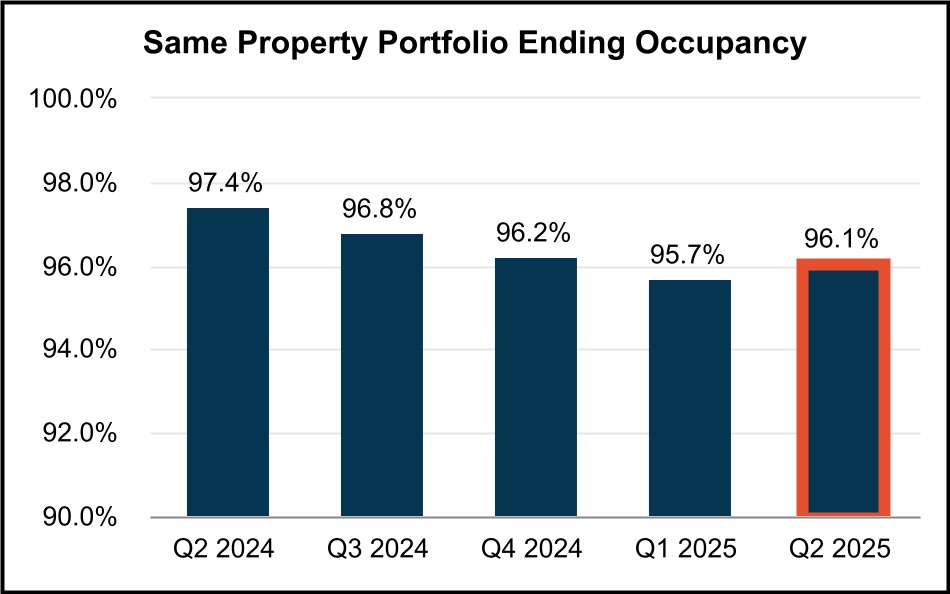
Same Property Portfolio ending occupancy(3)(4)
|
96.1% | 95.7% | 96.2% | 96.8% | 97.4% | ||||||||||||||||||||||||
Same Property Portfolio NOI growth(4)(5)
|
1.1% | 0.7% | |||||||||||||||||||||||||||
Same Property Portfolio Cash NOI growth(4)(5)
|
3.9% | 5.0% | |||||||||||||||||||||||||||
| Capitalization: | |||||||||||||||||||||||||||||
Total shares and units issued and outstanding at period end(6)
|
244,334,274 | 244,310,773 | 233,295,793 | 227,278,210 | 225,623,274 | ||||||||||||||||||||||||
| Series B and C Preferred Stock and Series 1, 2 and 3 CPOP Units | $ | 173,250 | $ | 173,250 | $ | 213,956 | $ | 213,956 | $ | 214,000 | |||||||||||||||||||
| Total equity market capitalization | $ | 8,864,220 | $ | 9,738,017 | $ | 9,233,171 | $ | 11,648,323 | $ | 10,274,542 | |||||||||||||||||||
| Total consolidated debt | $ | 3,379,141 | $ | 3,379,383 | $ | 3,379,622 | $ | 3,386,273 | $ | 3,386,559 | |||||||||||||||||||
| Total combined market capitalization (net debt plus equity) | $ | 11,812,244 | $ | 12,612,821 | $ | 12,556,822 | $ | 14,972,760 | $ | 13,535,391 | |||||||||||||||||||
| Ratios: | |||||||||||||||||||||||||||||
| Net debt to total combined market capitalization | 25.0% | 22.8% | 26.5% | 22.2% | 24.1% | ||||||||||||||||||||||||
Net debt to Adjusted EBITDAre (quarterly results annualized)
|
4.0x | 3.9x | 4.6x | 4.7x | 4.6x | ||||||||||||||||||||||||
(1)For definition/discussion of non-GAAP financial measures & reconciliations to their nearest GAAP equivalents, see definitions section & reconciliation section beginning on page 34 and page 12 of this report, respectively.
(2)Ending occupancy excluding repositioning/redevelopment excludes “Other Repositioning” projects as well as those listed individually on pages 26-31.
(3)Reflects the ending occupancy for the 2025 Same Property Portfolio for each period presented. For historical ending occupancy as reported in prior Supplemental packages, see “SPP Historical Information” on page 37.
(4)For comparability, Same Property Portfolio ending occupancy, NOI growth and Cash NOI growth for all comparable periods have been restated to remove the results of two properties that were sold during Q2’25 and two buildings that were moved to Other Repositioning. See page 32 for details related to dispositions.
(5)Represents the year over year percentage change in NOI and Cash NOI for the Same Property Portfolio.
(6)Includes the following # of OP Units/vested LTIP units held by noncontrolling interests: 8,182,445 (Jun 30, 2025), 8,700,301 (Mar 31, 2025), 8,426,905 (Dec 31, 2024), 8,175,868 (Sep 30, 2024) and 8,218,426 (Jun 30, 2024). Excludes the following # of shares of unvested restricted stock: 542,922 (Jun 30, 2025), 560,382 (Mar 31, 2025), 416,123 (Dec 31, 2024), 405,003 (Sep 30, 2024) and 435,225 (Jun 30, 2024). Excludes unvested LTIP units and unvested performance units.
|
Second Quarter 2025
Supplemental Financial Reporting Package
|
Page 6
|
|
||||||
Guidance.
|
||||||||
| As of June 30, 2025 | ||||||||
2025 OUTLOOK*
| METRIC |
Q2-2025 UPDATED
GUIDANCE
|
Q1-2025
GUIDANCE
|
YTD RESULTS AS OF JUNE 30, 2025 | |||||||||||||||||
Net Income Attributable to Common Stockholders per diluted share (1)(2)
|
$1.38 - $1.42 | $1.31 - $1.35 | $0.78 | |||||||||||||||||
Company share of Core FFO per diluted share (1)(2)
|
$2.37 - $2.41 | $2.37 - $2.41 | $1.21 | |||||||||||||||||
Same Property Portfolio NOI Growth - GAAP (3)
|
0.75% - 1.25% | 0.75% - 1.25% | 0.9% | |||||||||||||||||
Same Property Portfolio NOI Growth - Cash (3)
|
2.25% - 2.75% | 2.25% - 2.75% | 4.5% | |||||||||||||||||
Average Same Property Portfolio Occupancy (Full Year) (3)(4)
|
95.5% - 96.0% | 95.5% - 96.0% | 95.9% | |||||||||||||||||
Net General and Administrative Expenses (5)
|
+/- $82M | +/- $82M | $39.6M | |||||||||||||||||
| Net Interest Expense | +/- $107M | +/- $109.5M | $54.0M | |||||||||||||||||
(1)Our 2025 Net Income and Core FFO guidance refers to the Company's in-place portfolio as of June 30, 2025, and does not include any assumptions for additional prospective acquisitions, dispositions or related balance sheet activities that have not closed.
(2)See page 38 for a reconciliation of the Company’s 2025 guidance range of net income attributable to common stockholders per diluted share, the most directly comparable forward-looking GAAP financial measure, to Company share of Core FFO per diluted share.
(3)Our 2025 Same Property Portfolio is a subset of our consolidated portfolio and includes properties that were wholly owned by us for the period from January 1, 2024 through June 30, 2025, and excludes properties that were or will be classified as repositioning/redevelopment (current and future) or lease-up during 2024 and 2025 (as separately listed on pages 26-31) and select buildings in “Other Repositioning.” As of June 30, 2025, our 2025 Same Property Portfolio consisted of buildings aggregating 38.0 million rentable square feet at 289 of our properties, representing 80% of Q2-2025 total portfolio NOI.
(4)Calculated by averaging the occupancy rate at the end of each month during the year-to-date period and December 2024.
(5)Our Net 2025 General and Administrative expense guidance includes estimated non-cash equity compensation expense of $37.3 million.
* A number of factors could impact the Company’s ability to deliver results in line with its guidance, including, but not limited to, interest rates, inflation, the economy, the supply and demand of industrial real estate, the availability and terms of financing to the Company or to potential acquirers of real estate and the timing and yields for divestment and investment. There can be no assurance that the Company can achieve such results.
|
Second Quarter 2025
Supplemental Financial Reporting Package
|
Page 7
|
|
||||||
Guidance (Continued).
|
||||||||
| As of June 30, 2025 | ||||||||
2025 Guidance Rollforward (1)
| Earnings Components | Range ($ per share) |
Notes | ||||||||||||||||||
Q1 2025 Core FFO Per Diluted Share Guidance |
$2.37 | $2.41 | ||||||||||||||||||
| Same Property Portfolio NOI Growth | — | — | SP Net Effective NOI growth guidance unchanged 0.75% - 1.25% |
|||||||||||||||||
Repositioning/Redevelopment NOI |
(0.01) | (0.01) | Projected rent commencement timing extended |
|||||||||||||||||
Net General & Administrative Expenses (2)
|
— | — | Guidance unchanged +/- $82M |
|||||||||||||||||
| Net Interest Expense | 0.01 | 0.01 | Guidance updated +/- $107M |
|||||||||||||||||
Current 2025 Core FFO Per Diluted Share Guidance |
$2.37 | $2.41 | ||||||||||||||||||
| Core FFO Per Diluted Share Annual Growth | 1% | 3% | ||||||||||||||||||
(1)2025 Guidance and Guidance Rollforward represent the in-place portfolio as of June 30, 2025, and does not include any assumptions for additional prospective acquisitions, dispositions or related balance sheet activities that have not closed unless otherwise noted.
(2)Our Net 2025 General and Administrative expense guidance includes estimated non-cash equity compensation expense of $37.3 million.
|
Second Quarter 2025
Supplemental Financial Reporting Package
|
Page 8
|
|
||||||
Consolidated Balance Sheets.
|
||||||||
| (unaudited and in thousands) | ||||||||
| June 30, 2025 | March 31, 2025 | December 31, 2024 | September 30, 2024 | June 30, 2024 | |||||||||||||||||||||||||
| ASSETS | |||||||||||||||||||||||||||||
| Land | $ | 7,787,021 | $ | 7,797,744 | $ | 7,822,290 | $ | 7,703,232 | $ | 7,650,740 | |||||||||||||||||||
| Buildings and improvements | 4,594,494 | 4,573,881 | 4,611,987 | 4,416,032 | 4,330,709 | ||||||||||||||||||||||||
| Tenant improvements | 186,429 | 181,632 | 188,217 | 181,785 | 178,832 | ||||||||||||||||||||||||
| Furniture, fixtures, and equipment | 132 | 132 | 132 | 132 | 132 | ||||||||||||||||||||||||
| Construction in progress | 431,807 | 386,719 | 333,690 | 370,431 | 343,275 | ||||||||||||||||||||||||
| Total real estate held for investment | 12,999,883 | 12,940,108 | 12,956,316 | 12,671,612 | 12,503,688 | ||||||||||||||||||||||||
| Accumulated depreciation | (1,070,684) | (1,021,151) | (977,133) | (925,373) | (874,413) | ||||||||||||||||||||||||
| Investments in real estate, net | 11,929,199 | 11,918,957 | 11,979,183 | 11,746,239 | 11,629,275 | ||||||||||||||||||||||||
| Cash and cash equivalents | 431,117 | 504,579 | 55,971 | 61,836 | 125,710 | ||||||||||||||||||||||||
| Restricted cash | 130,071 | 50,105 | — | — | — | ||||||||||||||||||||||||
| Loan receivable, net | 123,474 | 123,359 | 123,244 | 123,129 | 123,014 | ||||||||||||||||||||||||
| Rents and other receivables, net | 12,861 | 17,622 | 15,772 | 17,315 | 17,685 | ||||||||||||||||||||||||
| Deferred rent receivable, net | 173,691 | 166,893 | 161,693 | 151,637 | 140,196 | ||||||||||||||||||||||||
| Deferred leasing costs, net | 71,482 | 70,404 | 67,827 | 69,152 | 68,161 | ||||||||||||||||||||||||
| Deferred loan costs, net | 7,892 | 1,642 | 1,999 | 2,356 | 2,713 | ||||||||||||||||||||||||
Acquired lease intangible assets, net(1)
|
169,036 | 182,444 | 201,467 | 205,510 | 220,021 | ||||||||||||||||||||||||
Acquired indefinite-lived intangible asset |
5,156 | 5,156 | 5,156 | 5,156 | 5,156 | ||||||||||||||||||||||||
Interest rate swap assets |
3,586 | 5,580 | 8,942 | 3,880 | 16,510 | ||||||||||||||||||||||||
| Other assets | 15,765 | 20,730 | 26,964 | 34,092 | 18,501 | ||||||||||||||||||||||||
| Acquisition related deposits | — | — | — | — | 1,250 | ||||||||||||||||||||||||
Assets associated with real estate held for sale, net(2)
|
6,282 | 18,386 | — | — | — | ||||||||||||||||||||||||
| Total Assets | $ | 13,079,612 | $ | 13,085,857 | $ | 12,648,218 | $ | 12,420,302 | $ | 12,368,192 | |||||||||||||||||||
| LIABILITIES & EQUITY | |||||||||||||||||||||||||||||
| Liabilities | |||||||||||||||||||||||||||||
| Notes payable | $ | 3,347,575 | $ | 3,348,060 | $ | 3,345,962 | $ | 3,350,190 | $ | 3,348,697 | |||||||||||||||||||
| Interest rate swap liability | 667 | — | — | 295 | — | ||||||||||||||||||||||||
| Accounts payable, accrued expenses and other liabilities | 124,814 | 141,999 | 149,707 | 169,084 | 153,993 | ||||||||||||||||||||||||
| Dividends and distributions payable | 105,594 | 105,285 | 97,823 | 95,288 | 94,582 | ||||||||||||||||||||||||
Acquired lease intangible liabilities, net(3)
|
129,683 | 136,661 | 147,473 | 155,328 | 163,109 | ||||||||||||||||||||||||
| Tenant security deposits | 90,757 | 90,050 | 90,698 | 91,983 | 91,162 | ||||||||||||||||||||||||
Tenant prepaid rents |
85,494 | 88,822 | 90,576 | 93,218 | 101,473 | ||||||||||||||||||||||||
Liabilities associated with real estate held for sale(2)
|
4 | 234 | — | — | — | ||||||||||||||||||||||||
| Total Liabilities | 3,884,588 | 3,911,111 | 3,922,239 | 3,955,386 | 3,953,016 | ||||||||||||||||||||||||
| Equity | |||||||||||||||||||||||||||||
| Series B preferred stock, net ($75,000 liquidation preference) | 72,443 | 72,443 | 72,443 | 72,443 | 72,443 | ||||||||||||||||||||||||
| Series C preferred stock, net ($86,250 liquidation preference) | 83,233 | 83,233 | 83,233 | 83,233 | 83,233 | ||||||||||||||||||||||||
| Preferred stock | 155,676 | 155,676 | 155,676 | 155,676 | 155,676 | ||||||||||||||||||||||||
| Common stock | 2,367 | 2,362 | 2,253 | 2,195 | 2,178 | ||||||||||||||||||||||||
| Additional paid in capital | 9,140,264 | 9,116,069 | 8,601,276 | 8,318,979 | 8,235,484 | ||||||||||||||||||||||||
| Cumulative distributions in excess of earnings | (462,309) | (474,550) | (441,881) | (407,695) | (381,507) | ||||||||||||||||||||||||
| Accumulated other comprehensive income (loss) | 1,092 | 3,582 | 6,746 | 1,474 | 13,834 | ||||||||||||||||||||||||
| Total stockholders’ equity | 8,837,090 | 8,803,139 | 8,324,070 | 8,070,629 | 8,025,665 | ||||||||||||||||||||||||
| Noncontrolling interests | 357,934 | 371,607 | 401,909 | 394,287 | 389,511 | ||||||||||||||||||||||||
| Total Equity | 9,195,024 | 9,174,746 | 8,725,979 | 8,464,916 | 8,415,176 | ||||||||||||||||||||||||
| Total Liabilities and Equity | $ | 13,079,612 | $ | 13,085,857 | $ | 12,648,218 | $ | 12,420,302 | $ | 12,368,192 | |||||||||||||||||||
(1)Includes net above-market tenant lease intangibles of $24,994 (Jun 30, 2025), $27,043 (Mar 31, 2025), $29,530 (Dec 31, 2024), $30,435 (Sep 30, 2024) and $32,936 (Jun 30, 2024), and a net below-market ground lease intangible of $12,436 (Jun 30, 2025), $12,477 (Mar 31, 2025), $12,518 (Dec 31, 2024), $12,559 (Sep 30, 2024) and $12,600 (Jun 30, 2024).
(2)As of June 30, 2025, our property located at 1332 & 1336 Rocky Point was classified as held for sale.
(3)Represents net below-market tenant lease intangibles as of the balance sheet date.
|
Second Quarter 2025
Supplemental Financial Reporting Package
|
Page 9
|
|
||||||
Consolidated Statements of Operations.
|
||||||||
| Quarterly Results | (unaudited and in thousands, except share and per share data) | |||||||
| Three Months Ended | |||||||||||||||||||||||||||||
| Jun 30, 2025 | Mar 31, 2025 | Dec 31, 2024 | Sep 30, 2024 | Jun 30, 2024 | |||||||||||||||||||||||||
| Revenues | |||||||||||||||||||||||||||||
Rental income(1)
|
$ | 241,568 | $ | 248,821 | $ | 239,737 | $ | 238,396 | $ | 232,973 | |||||||||||||||||||
| Management and leasing services | 132 | 142 | 167 | 156 | 156 | ||||||||||||||||||||||||
| Interest income | 7,807 | 3,324 | 2,991 | 3,291 | 4,444 | ||||||||||||||||||||||||
| Total Revenues | 249,507 | 252,287 | 242,895 | 241,843 | 237,573 | ||||||||||||||||||||||||
| Operating Expenses | |||||||||||||||||||||||||||||
| Property expenses | 55,298 | 55,261 | 56,006 | 54,867 | 51,905 | ||||||||||||||||||||||||
| General and administrative | 19,752 | 19,868 | 21,940 | 20,926 | 19,307 | ||||||||||||||||||||||||
| Depreciation and amortization | 71,188 | 86,740 | 71,832 | 69,241 | 67,896 | ||||||||||||||||||||||||
| Total Operating Expenses | 146,238 | 161,869 | 149,778 | 145,034 | 139,108 | ||||||||||||||||||||||||
| Other Expenses | |||||||||||||||||||||||||||||
| Other expenses | 244 | 2,239 | 34 | 492 | 304 | ||||||||||||||||||||||||
| Interest expense | 26,701 | 27,288 | 28,173 | 27,340 | 28,412 | ||||||||||||||||||||||||
| Total Expenses | 173,183 | 191,396 | 177,985 | 172,866 | 167,824 | ||||||||||||||||||||||||
| Debt extinguishment and modification expenses | (291) | — | — | — | — | ||||||||||||||||||||||||
| Gains on sale of real estate | 44,361 | 13,157 | — | 1,745 | 16,268 | ||||||||||||||||||||||||
| Net Income | 120,394 | 74,048 | 64,910 | 70,722 | 86,017 | ||||||||||||||||||||||||
| Less: net income attributable to noncontrolling interests | (4,060) | (2,849) | (2,725) | (2,952) | (3,541) | ||||||||||||||||||||||||
| Net income attributable to Rexford Industrial Realty, Inc. | 116,334 | 71,199 | 62,185 | 67,770 | 82,476 | ||||||||||||||||||||||||
| Less: preferred stock dividends | (2,315) | (2,314) | (2,315) | (2,314) | (2,315) | ||||||||||||||||||||||||
| Less: earnings allocated to participating securities | (592) | (539) | (457) | (395) | (409) | ||||||||||||||||||||||||
| Net income attributable to common stockholders | $ | 113,427 | $ | 68,346 | $ | 59,413 | $ | 65,061 | $ | 79,752 | |||||||||||||||||||
| Earnings per Common Share | |||||||||||||||||||||||||||||
| Net income attributable to common stockholders per share - basic | $ | 0.48 | $ | 0.30 | $ | 0.27 | $ | 0.30 | $ | 0.37 | |||||||||||||||||||
| Net income attributable to common stockholders per share - diluted | $ | 0.48 | $ | 0.30 | $ | 0.27 | $ | 0.30 | $ | 0.37 | |||||||||||||||||||
| Weighted average shares outstanding - basic | 236,098,831 | 227,395,984 | 222,516,006 | 218,759,979 | 217,388,908 | ||||||||||||||||||||||||
| Weighted average shares outstanding - diluted | 236,098,831 | 227,395,984 | 222,856,120 | 219,133,037 | 217,388,908 | ||||||||||||||||||||||||
(1)We elected the “non-separation practical expedient” in ASC 842, which allows us to avoid separating lease and non-lease rental income. As a result of this election, all rental income earned pursuant to tenant leases, including tenant reimbursements, is reflected as one line, “Rental income,” in the consolidated statements of operations. Under the section “Rental Income” on page 37 in the definitions section of this report, we include a presentation of rental revenues, tenant reimbursements and other income for all periods because we believe this information is frequently used by management, investors, securities analysts and other interested parties to evaluate our performance.
|
Second Quarter 2025
Supplemental Financial Reporting Package
|
Page 10
|
|
||||||
Consolidated Statements of Operations.
|
||||||||
| Quarterly Results (continued) | (unaudited and in thousands, except share and per share data) | |||||||
| Three Months Ended June 30, | Six Months Ended June 30, | ||||||||||||||||||||||
| 2025 | 2024 | 2025 | 2024 | ||||||||||||||||||||
| Revenues | |||||||||||||||||||||||
| Rental income | $ | 241,568 | $ | 232,973 | $ | 490,389 | $ | 443,963 | |||||||||||||||
| Management and leasing services | 132 | 156 | 274 | 288 | |||||||||||||||||||
| Interest income | 7,807 | 4,444 | 11,131 | 7,418 | |||||||||||||||||||
| Total Revenues | 249,507 | 237,573 | 501,794 | 451,669 | |||||||||||||||||||
| Operating Expenses | |||||||||||||||||||||||
| Property expenses | 55,298 | 51,905 | 110,559 | 99,387 | |||||||||||||||||||
| General and administrative | 19,752 | 19,307 | 39,620 | 39,287 | |||||||||||||||||||
| Depreciation and amortization | 71,188 | 67,896 | 157,928 | 134,174 | |||||||||||||||||||
| Total Operating Expenses | 146,238 | 139,108 | 308,107 | 272,848 | |||||||||||||||||||
| Other Expenses | |||||||||||||||||||||||
| Other expenses | 244 | 304 | 2,483 | 1,712 | |||||||||||||||||||
| Interest expense | 26,701 | 28,412 | 53,989 | 43,083 | |||||||||||||||||||
| Total Expenses | 173,183 | 167,824 | 364,579 | 317,643 | |||||||||||||||||||
Debt extinguishment and modification expenses |
(291) | — | (291) | — | |||||||||||||||||||
| Gains on sale of real estate | 44,361 | 16,268 | 57,518 | 16,268 | |||||||||||||||||||
| Net Income | 120,394 | 86,017 | 194,442 | 150,294 | |||||||||||||||||||
| Less: net income attributable to noncontrolling interests | (4,060) | (3,541) | (6,909) | (6,447) | |||||||||||||||||||
| Net income attributable to Rexford Industrial Realty, Inc. | 116,334 | 82,476 | 187,533 | 143,847 | |||||||||||||||||||
| Less: preferred stock dividends | (2,315) | (2,315) | (4,629) | (4,629) | |||||||||||||||||||
| Less: earnings allocated to participating securities | (592) | (409) | (1,131) | (827) | |||||||||||||||||||
| Net income attributable to common stockholders | $ | 113,427 | $ | 79,752 | $ | 181,773 | $ | 138,391 | |||||||||||||||
| Net income attributable to common stockholders per share – basic | $ | 0.48 | $ | 0.37 | $ | 0.78 | $ | 0.64 | |||||||||||||||
| Net income attributable to common stockholders per share – diluted | $ | 0.48 | $ | 0.37 | $ | 0.78 | $ | 0.64 | |||||||||||||||
| Weighted-average shares of common stock outstanding – basic | 236,098,831 | 217,388,908 | 231,771,448 | 215,895,285 | |||||||||||||||||||
| Weighted-average shares of common stock outstanding – diluted | 236,098,831 | 217,388,908 | 231,771,448 | 215,913,411 | |||||||||||||||||||
|
Second Quarter 2025
Supplemental Financial Reporting Package
|
Page 11
|
|
||||||
|
Non-GAAP FFO and Core FFO Reconciliations.(1)
|
||||||||
| (unaudited and in thousands, except share and per share data) | ||||||||
| Three Months Ended | |||||||||||||||||||||||||||||
| June 30, 2025 | March 31, 2025 | December 31, 2024 | September 30, 2024 | June 30, 2024 | |||||||||||||||||||||||||
| Net Income | $ | 120,394 | $ | 74,048 | $ | 64,910 | $ | 70,722 | $ | 86,017 | |||||||||||||||||||
| Adjustments: | |||||||||||||||||||||||||||||
| Depreciation and amortization | 71,188 | 86,740 | 71,832 | 69,241 | 67,896 | ||||||||||||||||||||||||
| Gains on sale of real estate | (44,361) | (13,157) | — | (1,745) | (16,268) | ||||||||||||||||||||||||
NAREIT Defined Funds From Operations (FFO)
|
147,221 | 147,631 | 136,742 | 138,218 | 137,645 | ||||||||||||||||||||||||
| Less: preferred stock dividends | (2,315) | (2,314) | (2,315) | (2,314) | (2,315) | ||||||||||||||||||||||||
Less: FFO attributable to noncontrolling interests(2)
|
(4,962) | (5,394) | (5,283) | (5,389) | (5,410) | ||||||||||||||||||||||||
Less: FFO attributable to participating securities(3)
|
(728) | (750) | (624) | (566) | (582) | ||||||||||||||||||||||||
| Company share of FFO | $ | 139,216 | $ | 139,173 | $ | 128,520 | $ | 129,949 | $ | 129,338 | |||||||||||||||||||
| Company share of FFO per common share‐basic | $ | 0.59 | $ | 0.61 | $ | 0.58 | $ | 0.59 | $ | 0.59 | |||||||||||||||||||
| Company share of FFO per common share‐diluted | $ | 0.59 | $ | 0.61 | $ | 0.58 | $ | 0.59 | $ | 0.59 | |||||||||||||||||||
| FFO | $ | 147,221 | $ | 147,631 | $ | 136,742 | $ | 138,218 | $ | 137,645 | |||||||||||||||||||
| Adjustments: | |||||||||||||||||||||||||||||
| Acquisition expenses | 23 | 79 | 9 | 6 | 58 | ||||||||||||||||||||||||
| Debt extinguishment and modification expenses | 291 | — | — | — | — | ||||||||||||||||||||||||
| Amortization of loss on termination of interest rate swaps | — | — | 34 | 59 | 59 | ||||||||||||||||||||||||
| Non-capitalizable demolition costs | — | 365 | — | — | 129 | ||||||||||||||||||||||||
Severance costs associated with workforce reduction(4)
|
199 | 1,483 | — | — | — | ||||||||||||||||||||||||
| Core FFO | 147,734 | 149,558 | 136,785 | 138,283 | 137,891 | ||||||||||||||||||||||||
| Less: preferred stock dividends | (2,315) | (2,314) | (2,315) | (2,314) | (2,315) | ||||||||||||||||||||||||
Less: Core FFO attributable to noncontrolling interests(2)
|
(4,979) | (5,461) | (5,284) | (5,391) | (5,418) | ||||||||||||||||||||||||
Less: Core FFO attributable to participating securities(3)
|
(731) | (760) | (624) | (567) | (583) | ||||||||||||||||||||||||
| Company share of Core FFO | $ | 139,709 | $ | 141,023 | $ | 128,562 | $ | 130,011 | $ | 129,575 | |||||||||||||||||||
| Company share of Core FFO per common share‐basic | $ | 0.59 | $ | 0.62 | $ | 0.58 | $ | 0.59 | $ | 0.60 | |||||||||||||||||||
| Company share of Core FFO per common share‐diluted | $ | 0.59 | $ | 0.62 | $ | 0.58 | $ | 0.59 | $ | 0.60 | |||||||||||||||||||
| Weighted-average shares outstanding-basic | 236,098,831 | 227,395,984 | 222,516,006 | 218,759,979 | 217,388,908 | ||||||||||||||||||||||||
Weighted-average shares outstanding-diluted(5)
|
236,098,831 | 227,395,984 | 222,856,120 | 219,133,037 | 217,388,908 | ||||||||||||||||||||||||
(1)For a definition and discussion of non-GAAP financial measures, see the definitions section beginning on page 34 of this report.
(2)Noncontrolling interests relate to interests in the Company’s operating partnership, represented by common units and preferred units (Series 1, Series 2 and Series 3 CPOP units) of partnership interests in the operating partnership that are owned by unit holders other than the Company. On April 10, 2024, we exercised our conversion right to convert all Series 1 CPOP units into OP units. On March 6, 2025, we exercised our conversion right to convert all remaining Series 2 CPOP units into OP Units.
(3)Participating securities include unvested shares of restricted stock, unvested LTIP units and unvested performance units.
(4)Amounts are included in the line item “Other expenses” in the consolidated statements of operations.
(5)Weighted-average shares outstanding-diluted includes adjustments for unvested performance units and shares issuable under forward equity sales agreements if the effect is dilutive for the reported period.
|
Second Quarter 2025
Supplemental Financial Reporting Package
|
Page 12
|
|
||||||
Non-GAAP FFO and Core FFO Reconciliations.(1)
|
||||||||
| (unaudited and in thousands, except share and per share data) | ||||||||
| Three Months Ended June 30, | Six Months Ended June 30, | |||||||||||||||||||||||||
| 2025 | 2024 | 2025 | 2024 | |||||||||||||||||||||||
| Net Income | $ | 120,394 | $ | 86,017 | $ | 194,442 | $ | 150,294 | ||||||||||||||||||
| Adjustments: | ||||||||||||||||||||||||||
| Depreciation and amortization | 71,188 | 67,896 | 157,928 | 134,174 | ||||||||||||||||||||||
| Gains on sale of real estate | (44,361) | (16,268) | (57,518) | (16,268) | ||||||||||||||||||||||
| Funds From Operations (FFO) | 147,221 | 137,645 | 294,852 | 268,200 | ||||||||||||||||||||||
| Less: preferred stock dividends | (2,315) | (2,315) | (4,629) | (4,629) | ||||||||||||||||||||||
| Less: FFO attributable to noncontrolling interests | (4,962) | (5,410) | (10,356) | (10,598) | ||||||||||||||||||||||
| Less: FFO attributable to participating securities | (728) | (582) | (1,478) | (1,152) | ||||||||||||||||||||||
| Company share of FFO | $ | 139,216 | $ | 129,338 | $ | 278,389 | $ | 251,821 | ||||||||||||||||||
| Company share of FFO per common share‐basic | $ | 0.59 | $ | 0.59 | $ | 1.20 | $ | 1.17 | ||||||||||||||||||
| Company share of FFO per common share‐diluted | $ | 0.59 | $ | 0.59 | $ | 1.20 | $ | 1.17 | ||||||||||||||||||
| FFO | $ | 147,221 | $ | 137,645 | $ | 294,852 | $ | 268,200 | ||||||||||||||||||
| Adjustments: | ||||||||||||||||||||||||||
| Acquisition expenses | 23 | 58 | 102 | 108 | ||||||||||||||||||||||
| Debt extinguishment and modification expenses | 291 | — | 291 | — | ||||||||||||||||||||||
| Amortization of loss on termination of interest rate swaps | — | 59 | — | 118 | ||||||||||||||||||||||
| Non-capitalizable demolition costs | — | 129 | 365 | 1,127 | ||||||||||||||||||||||
Severance costs associated with workforce reduction(2)
|
199 | — | 1,682 | — | ||||||||||||||||||||||
| Core FFO | 147,734 | 137,891 | 297,292 | 269,553 | ||||||||||||||||||||||
| Less: preferred stock dividends | (2,315) | (2,315) | (4,629) | (4,629) | ||||||||||||||||||||||
| Less: Core FFO attributable to noncontrolling interests | (4,979) | (5,418) | (10,440) | (10,644) | ||||||||||||||||||||||
| Less: Core FFO attributable to participating securities | (731) | (583) | (1,491) | (1,158) | ||||||||||||||||||||||
| Company share of Core FFO | $ | 139,709 | $ | 129,575 | $ | 280,732 | $ | 253,122 | ||||||||||||||||||
| Company share of Core FFO per common share‐basic | $ | 0.59 | $ | 0.60 | $ | 1.21 | $ | 1.17 | ||||||||||||||||||
| Company share of Core FFO per common share‐diluted | $ | 0.59 | $ | 0.60 | $ | 1.21 | $ | 1.17 | ||||||||||||||||||
| Weighted-average shares outstanding-basic | 236,098,831 | 217,388,908 | 231,771,448 | 215,895,285 | ||||||||||||||||||||||
| Weighted-average shares outstanding-diluted | 236,098,831 | 217,388,908 | 231,771,448 | 215,913,411 | ||||||||||||||||||||||
(1)For a definition and discussion of non-GAAP financial measures, see the definitions section beginning on page 34 of this report.
(2)Amounts are included in the line item “Other expenses” in the consolidated statements of operations.
|
Second Quarter 2025
Supplemental Financial Reporting Package
|
Page 13
|
|
||||||
Non-GAAP AFFO Reconciliation.(1)
|
||||||||
| (unaudited and in thousands, except share and per share data) | ||||||||
| Three Months Ended | |||||||||||||||||||||||||||||
| June 30, 2025 |
March 31, 2025 |
December 31, 2024 |
September 30, 2024 |
June 30, 2024 |
|||||||||||||||||||||||||
Funds From Operations(2)
|
$ | 147,221 | $ | 147,631 | $ | 136,742 | $ | 138,218 | $ | 137,645 | |||||||||||||||||||
| Adjustments: | |||||||||||||||||||||||||||||
| Amortization of deferred financing costs | 1,255 | 1,134 | 1,246 | 1,252 | 1,266 | ||||||||||||||||||||||||
| Non-cash stock compensation | 10,091 | 9,699 | 11,539 | 9,918 | 11,057 | ||||||||||||||||||||||||
| Debt extinguishment and modification expenses | 291 | — | — | — | — | ||||||||||||||||||||||||
| Amortization related to termination/settlement of interest rate derivatives | 76 | 77 | 112 | 136 | 137 | ||||||||||||||||||||||||
| Note payable (discount) premium amortization, net | 1,579 | 1,560 | 1,534 | 1,511 | 1,491 | ||||||||||||||||||||||||
| Non-capitalizable demolition costs | — | 365 | — | — | 129 | ||||||||||||||||||||||||
| Severance costs associated with workforce reduction | 199 | 1,483 | — | — | — | ||||||||||||||||||||||||
| Deduct: | |||||||||||||||||||||||||||||
| Preferred stock dividends | (2,315) | (2,314) | (2,315) | (2,314) | (2,315) | ||||||||||||||||||||||||
Straight line rental revenue adjustment(3)
|
(6,918) | (5,517) | (10,057) | (11,441) | (9,567) | ||||||||||||||||||||||||
| Above/(below) market lease revenue adjustments | (5,788) | (9,186) | (6,159) | (6,635) | (7,268) | ||||||||||||||||||||||||
Capitalized payments(4)
|
(14,368) | (13,321) | (12,102) | (13,900) | (12,280) | ||||||||||||||||||||||||
| Accretion of net loan origination fees | (115) | (115) | (115) | (115) | (115) | ||||||||||||||||||||||||
Recurring capital expenditures(5)
|
(5,887) | (1,311) | (7,882) | (5,254) | (3,502) | ||||||||||||||||||||||||
2nd generation tenant improvements(6)
|
(663) | (162) | (296) | (18) | (123) | ||||||||||||||||||||||||
2nd generation leasing commissions(7)
|
(4,162) | (4,879) | (3,520) | (2,660) | (7,436) | ||||||||||||||||||||||||
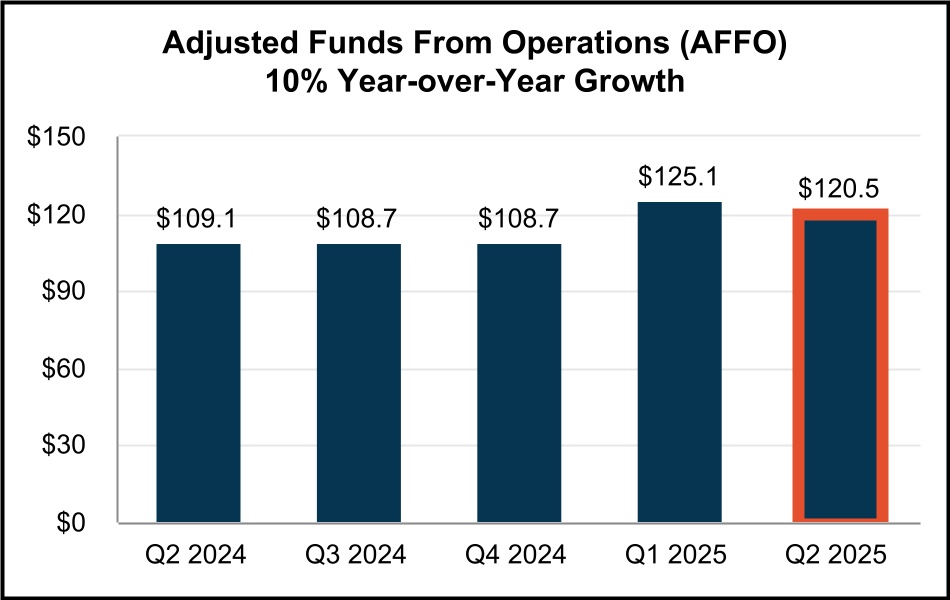
| Adjusted Funds From Operations (AFFO) | $ | 120,496 | $ | 125,144 | $ | 108,727 | $ | 108,698 | $ | 109,119 | |||||||||||||||||||
(1)For a definition and discussion of non-GAAP financial measures, see the definitions section beginning on page 34 of this report.
(2)A quarterly reconciliation of net income to Funds From Operations is set forth on page 12 of this report.
(3)The straight line rental revenue adjustment includes concessions of $5,844, $7,035, $8,504, $7,600 and $4,586 for the three months ended June 30, 2025, March 31, 2025, December 31, 2024, September 30, 2024 and June 30, 2024, respectively.
(4)Includes capitalized interest, taxes, insurance and construction-related compensation costs.
(5)Excludes nonrecurring capital expenditures of $65,376, $43,361, 67,594, 94,436 and $89,120 for the three months ended June 30, 2025, March 31, 2025, December 31, 2024, September 30, 2024 and June 30, 2024, respectively.
(6)Excludes 1st generation tenant improvements of $292, $798, $189, $470 and $681 for the three months ended June 30, 2025, March 31, 2025, December 31, 2024, September 30, 2024 and June 30, 2024, respectively.
(7)Excludes 1st generation leasing commissions of $1,879, $3,058, $290, $2,776 and $3,921 for the three months ended June 30, 2025, March 31, 2025, December 31, 2024, September 30, 2024 and June 30, 2024, respectively.
|
Second Quarter 2025
Supplemental Financial Reporting Package
|
Page 14
|
|
||||||
Statement of Operations Reconciliations - NOI, Cash NOI, EBITDAre and Adjusted EBITDAre.(1)
| ||||||||
| (unaudited and in thousands) | ||||||||
| NOI and Cash NOI | |||||||||||||||||||||||||||||
| Three Months Ended | |||||||||||||||||||||||||||||
| Jun 30, 2025 | Mar 31, 2025 | Dec 31, 2024 | Sep 30, 2024 | Jun 30, 2024 | |||||||||||||||||||||||||
Rental income(2)(3)(4)
|
$ | 241,568 | $ | 248,821 | $ | 239,737 | $ | 238,396 | $ | 232,973 | |||||||||||||||||||
| Less: Property expenses | 55,298 | 55,261 | 56,006 | 54,867 | 51,905 | ||||||||||||||||||||||||
| Net Operating Income (NOI) | $ | 186,270 | $ | 193,560 | $ | 183,731 | $ | 183,529 | $ | 181,068 | |||||||||||||||||||
Above/(below) market lease revenue adjustments |
(5,788) | (9,186) | (6,159) | (6,635) | (7,268) | ||||||||||||||||||||||||
| Straight line rental revenue adjustment | (6,918) | (5,517) | (10,057) | (11,441) | (9,567) | ||||||||||||||||||||||||
| Cash NOI | $ | 173,564 | $ | 178,857 | $ | 167,515 | $ | 165,453 | $ | 164,233 | |||||||||||||||||||
EBITDAre and Adjusted EBITDAre
|
|||||||||||||||||||||||||||||
| Three Months Ended | |||||||||||||||||||||||||||||
| Jun 30, 2025 | Mar 31, 2025 | Dec 31, 2024 | Sep 30, 2024 | Jun 30, 2024 | |||||||||||||||||||||||||
| Net income | $ | 120,394 | $ | 74,048 | $ | 64,910 | $ | 70,722 | $ | 86,017 | |||||||||||||||||||
| Interest expense | 26,701 | 27,288 | 28,173 | 27,340 | 28,412 | ||||||||||||||||||||||||
| Depreciation and amortization | 71,188 | 86,740 | 71,832 | 69,241 | 67,896 | ||||||||||||||||||||||||
| Gains on sale of real estate | (44,361) | (13,157) | — | (1,745) | (16,268) | ||||||||||||||||||||||||
EBITDAre
|
$ | 173,922 | $ | 174,919 | $ | 164,915 | $ | 165,558 | $ | 166,057 | |||||||||||||||||||
| Stock-based compensation amortization | 10,091 | 9,699 | 11,539 | 9,918 | 11,057 | ||||||||||||||||||||||||
| Debt extinguishment and modification expenses | 291 | — | — | — | — | ||||||||||||||||||||||||
| Acquisition expenses | 23 | 79 | 9 | 6 | 58 | ||||||||||||||||||||||||
Pro forma effect of acquisitions(5)
|
— | — | 2,884 | 426 | 1,058 | ||||||||||||||||||||||||
Pro forma effect of dispositions(6)
|
(216) | 162 | — | 21 | (124) | ||||||||||||||||||||||||
Adjusted EBITDAre
|
$ | 184,111 | $ | 184,859 | $ | 179,347 | $ | 175,929 | $ | 178,106 | |||||||||||||||||||
(1)For a definition and discussion of non-GAAP financial measures, see the definitions section beginning on page 34 of this report.
(2)See footnote (1) on page 10 for details related to our presentation of “Rental income” in the consolidated statements of operations for all periods presented.
(3)Reflects (decrease) increase to rental income due to changes in the Company’s assessment of lease payment collectability as follows (in thousands): $(141), $(2,303), $(200), $(730) and $(804) for the three months ended June 30, 2025, March 31, 2025, December 31, 2024, September 30, 2024 and June 30, 2024, respectively.
(4)Rental income includes net lease termination income (in thousands) of $0, $8,935, $614, $0 and $103 for the three months ended June 30, 2025, March 31, 2025, December 31, 2024, September 30, 2024 and June 30, 2024, respectively. Amounts include lease termination fees and write-offs of straight-line rent and above/(below) market lease intangibles associated with lease terminations.
(5)Represents the estimated impact on Q4'24 EBITDAre of Q4'24 acquisitions as if they had been acquired on October 1, 2024, the impact on Q3'24 EBITDAre of Q3'24 acquisitions as if they had been acquired on July 1, 2024 and the impact on Q2'24 EBITDAre of Q2'24 acquisitions as if they had been acquired on April 1, 2024. We have made a number of assumptions in such estimates and there can be no assurance that we would have generated the projected levels of EBITDAre had we acquired these as of the beginning of each period.
(6)Represents the estimated impact on Q2'25 EBITDAre of Q2'25 dispositions as if they had been sold as of April 1, 2025, the impact on Q1'25 EBITDAre of Q1'25 dispositions as if they had been sold as of January 1, 2025, the impact on Q3'24 EBITDAre of Q3'24 dispositions as if they had been sold as of July 1, 2024 and the impact on Q2'24 EBITDAre of Q2'24 dispositions as if they had been sold as of April 1, 2024.
|
Second Quarter 2025
Supplemental Financial Reporting Package
|
Page 15
|
|
||||||
Same Property Portfolio Performance.(1)
|
||||||||
| (unaudited and dollars in thousands) | ||||||||
| Same Property Portfolio: | ||||||||||||||||||||||||||||||||||||||||||||||||||
| Number of properties | 289 | |||||||||||||||||||||||||||||||||||||||||||||||||
| Square Feet | 37,991,248 | |||||||||||||||||||||||||||||||||||||||||||||||||
| Same Property Portfolio NOI and Cash NOI: | ||||||||||||||||||||||||||||||||||||||||||||||||||
| Three Months Ended June 30, | Six Months Ended June 30, | |||||||||||||||||||||||||||||||||||||||||||||||||
| 2025 | 2024 | $ Change | % Change | 2025 | 2024 | $ Change | % Change | |||||||||||||||||||||||||||||||||||||||||||
Rental income(2)(3)(4)
|
$ | 191,653 | $ | 188,183 | $ | 3,470 | 1.8% | $ | 380,012 | $ | 374,370 | $ | 5,642 | 1.5% | ||||||||||||||||||||||||||||||||||||
| Property expenses | 42,060 | 40,242 | 1,818 | 4.5% | 83,534 | 80,500 | 3,034 | 3.8% | ||||||||||||||||||||||||||||||||||||||||||
| Same Property Portfolio NOI | $ | 149,593 | $ | 147,941 | $ | 1,652 | 1.1% | (4) |
$ | 296,478 | $ | 293,870 | $ | 2,608 | 0.9% | (4) |
||||||||||||||||||||||||||||||||||
Straight-line rental revenue adjustment |
(4,804) | (7,503) | 2,699 | (36.0)% | (7,959) | (14,758) | 6,799 | (46.1)% | ||||||||||||||||||||||||||||||||||||||||||
Above/(below) market lease revenue adjustments |
(5,129) | (6,034) | 905 | (15.0)% | (10,001) | (12,471) | 2,470 | (19.8)% | ||||||||||||||||||||||||||||||||||||||||||
| Same Property Portfolio Cash NOI | $ | 139,660 | $ | 134,404 | $ | 5,256 | 3.9% | (4) |
$ | 278,518 | $ | 266,641 | $ | 11,877 | 4.5% | (4) |
||||||||||||||||||||||||||||||||||
| Same Property Portfolio Occupancy: | |||||||||||||||||||||||||||||
| Three Months Ended June 30, | |||||||||||||||||||||||||||||
| 2025 | 2024 | Year-over-Year Change (basis points) |
Three Months Ended March 31, 2025(5)
|
Sequential Change (basis points) |
|||||||||||||||||||||||||
Quarterly Weighted Average Occupancy:(5)
|
|||||||||||||||||||||||||||||
| Los Angeles County | 95.6% | 97.1% | (150) bps | 95.6% | — bps | ||||||||||||||||||||||||
| Orange County | 99.0% | 99.7% | (70) bps | 99.1% | (10) bps | ||||||||||||||||||||||||
| Riverside / San Bernardino County | 96.6% | 96.7% | (10) bps | 96.7% | (10) bps | ||||||||||||||||||||||||
| San Diego County | 96.1% | 96.0% | 10 bps | 96.1% | — bps | ||||||||||||||||||||||||
| Ventura County | 91.4% | 94.4% | (300) bps | 91.4% | — bps | ||||||||||||||||||||||||
| Quarterly Weighted Average Occupancy | 95.9% | 97.0% | (110) bps | 95.9% | — bps | ||||||||||||||||||||||||
| Ending Occupancy: | 96.1% | 97.4% | (130) bps | 95.7% | 40 bps | ||||||||||||||||||||||||
(1)For a definition and discussion of non-GAAP financial measures, see the definitions section beginning on page 34 of this report.
(2)See “Same Property Portfolio Rental Income” on page 37 of the definitions section of this report for a breakdown of rental income into rental revenues, tenant reimbursements and other income for the three and six months ended June 30, 2025 and 2024.
(3)Reflects (decrease) increase to rental income due to changes in the Company’s assessment of lease payment collectability as follows: $(65) thousand and $(571) thousand for the three months ended June 30, 2025 and 2024, respectively, and $(2,372) thousand and $(1,976) thousand for the six months ended June 30, 2025 and 2024.
(4)Rental income includes lease termination fees of $0 thousand and $122 thousand for the three months ended June 30, 2025 and 2024, respectively, and $20 thousand and $131 thousand for the six months ended June 30, 2025 and 2024, respectively. Excluding these lease termination fees, Same Property Portfolio NOI increased by approximately 1.2% and 0.9% and Same Property Portfolio Cash NOI increased by approximately 4.0% and 4.5% during the three and six months ended June 30, 2025, compared to the three and six months ended June 30, 2024, respectively.
(5)Calculated by averaging the occupancy rate at the end of each month in 2Q-2025 and March 2025 (for 2Q-2025), the end of each month in 2Q-2024 and March 2024 (for 2Q-2024) and the end of each month in 1Q-2025 and December 2024 (for 1Q-2025).
|
Second Quarter 2025
Supplemental Financial Reporting Package
|
Page 16
|
|
||||||
Capitalization Summary.
|
||||||||
| (unaudited and in thousands, except share and per share data) | ||||||||
| Capitalization as of June 30, 2025 | ||||||||

| Description | June 30, 2025 | March 31, 2025 | December 31, 2024 | September 30, 2024 | June 30, 2024 | ||||||||||||||||||||||||
Common shares outstanding(1)
|
236,151,829 | 235,610,472 | 224,868,888 | 219,102,342 | 217,404,848 | ||||||||||||||||||||||||
Operating partnership units outstanding(2)
|
8,182,445 | 8,700,301 | 8,426,905 | 8,175,868 | 8,218,426 | ||||||||||||||||||||||||
| Total shares and units outstanding at period end | 244,334,274 | 244,310,773 | 233,295,793 | 227,278,210 | 225,623,274 | ||||||||||||||||||||||||
| Share price at end of quarter | $ | 35.57 | $ | 39.15 | $ | 38.66 | $ | 50.31 | $ | 44.59 | |||||||||||||||||||
| Common Stock and Operating Partnership Units - Capitalization | $ | 8,690,970 | $ | 9,564,767 | $ | 9,019,215 | $ | 11,434,367 | $ | 10,060,542 | |||||||||||||||||||
Series B and C Cumulative Redeemable Preferred Stock(3)
|
$ | 161,250 | $ | 161,250 | $ | 161,250 | $ | 161,250 | $ | 161,250 | |||||||||||||||||||
4.00% Series 2 Cumulative Redeemable Convertible Preferred Units(4)
|
— | — | 40,706 | 40,706 | 40,750 | ||||||||||||||||||||||||
3.00% Series 3 Cumulative Redeemable Convertible Preferred Units(4)
|
12,000 | 12,000 | 12,000 | 12,000 | 12,000 | ||||||||||||||||||||||||
| Preferred Equity | $ | 173,250 | $ | 173,250 | $ | 213,956 | $ | 213,956 | $ | 214,000 | |||||||||||||||||||
| Total Equity Market Capitalization | $ | 8,864,220 | $ | 9,738,017 | $ | 9,233,171 | $ | 11,648,323 | $ | 10,274,542 | |||||||||||||||||||
| Total Debt | $ | 3,379,141 | $ | 3,379,383 | $ | 3,379,622 | $ | 3,386,273 | $ | 3,386,559 | |||||||||||||||||||
| Less: Cash and cash equivalents | (431,117) | (504,579) | (55,971) | (61,836) | (125,710) | ||||||||||||||||||||||||
| Net Debt | $ | 2,948,024 | $ | 2,874,804 | $ | 3,323,651 | $ | 3,324,437 | $ | 3,260,849 | |||||||||||||||||||
| Total Combined Market Capitalization (Net Debt plus Equity) | $ | 11,812,244 | $ | 12,612,821 | $ | 12,556,822 | $ | 14,972,760 | $ | 13,535,391 | |||||||||||||||||||
| Net debt to total combined market capitalization | 25.0 | % | 22.8 | % | 26.5 | % | 22.2 | % | 24.1 | % | |||||||||||||||||||
Net debt to Adjusted EBITDAre (quarterly results annualized)(5)
|
4.0x | 3.9x | 4.6x | 4.7x | 4.6x | ||||||||||||||||||||||||
Net debt & preferred equity to Adjusted EBITDAre (quarterly results annualized)(5)
|
4.2x | 4.1x | 4.9x | 5.0x | 4.9x | ||||||||||||||||||||||||
(1)Excludes the following number of shares of unvested restricted stock: 542,922 (Jun 30, 2025), 560,382 (Mar 31, 2025), 416,123 (Dec 31, 2024), 405,003 (Sep 30, 2024) and 435,225 (Jun 30, 2024).
(2)Represents outstanding common units of the Company’s operating partnership (“OP”), Rexford Industrial Realty, LP, that are owned by unitholders other than Rexford Industrial Realty, Inc. Represents the noncontrolling interest in our OP. As of Jun 30, 2025, includes 1,260,083 vested LTIP Units & 1,262,969 vested performance units & excludes 463,555 unvested LTIP Units & 2,278,110 unvested performance units.
(3)Values based on liquidation preference of $25 per share and the following number of outstanding shares of preferred stock: 5.875% Series B (3,000,000); 5.625% Series C (3,450,000).
(4)Value based on 904,583 outstanding Series 2 preferred units at a liquidation preference of $45 per unit and 164,998 outstanding Series 3 preferred units at a liquidation preference of $72.72825 per unit. On March 6, 2025, we exercised our conversion right to convert all remaining 904,583 Series 2 preferred units into OP Units.
(5)For definition/discussion of non-GAAP financial measures and reconciliations to their nearest GAAP equivalents, see the definitions section & reconciliation section beginning on page 34 and page 12 of this report, respectively.
|
Second Quarter 2025
Supplemental Financial Reporting Package
|
Page 17
|
|
||||||
Debt Summary.
|
||||||||
| (unaudited and dollars in thousands) | ||||||||
| Debt Detail: | ||||||||||||||||||||||||||
| As of June 30, 2025 | ||||||||||||||||||||||||||
| Debt Description | Maturity Date | Stated Interest Rate |
Effective
Interest Rate(1)
|
Principal
Balance(2)
|
||||||||||||||||||||||
| Unsecured Debt: | ||||||||||||||||||||||||||
$1.25 Billion Revolving Credit Facility(3)
|
5/30/2029(4)
|
SOFR+0.725%(5)
|
5.175% | $ | — | |||||||||||||||||||||
| $100M Senior Notes | 8/6/2025 | 4.290% | 4.290% | 100,000 | ||||||||||||||||||||||
$575M Exchangeable 2027 Senior Notes(6)
|
3/15/2027 | 4.375% | 4.375% | 575,000 | ||||||||||||||||||||||
| $300M Term Loan Facility | 5/26/2027 |
SOFR+0.80%(5)
|
3.717%(7)
|
300,000 | ||||||||||||||||||||||
| $125M Senior Notes | 7/13/2027 | 3.930% | 3.930% | 125,000 | ||||||||||||||||||||||
| $300M Senior Notes | 6/15/2028 | 5.000% | 5.000% | 300,000 | ||||||||||||||||||||||
$575M Exchangeable 2029 Senior Notes(6)
|
3/15/2029 | 4.125% | 4.125% | 575,000 | ||||||||||||||||||||||
| $25M Series 2019A Senior Notes | 7/16/2029 | 3.880% | 3.880% | 25,000 | ||||||||||||||||||||||
| $400M Senior Notes | 12/1/2030 | 2.125% | 2.125% | 400,000 | ||||||||||||||||||||||
| $400M Term Loan Facility | 5/30/2030 |
SOFR+0.80%(5)
|
4.214%(8)
|
400,000 | ||||||||||||||||||||||
| $400M Senior Notes - Green Bond | 9/1/2031 | 2.150% | 2.150% | 400,000 | ||||||||||||||||||||||
| $75M Series 2019B Senior Notes | 7/16/2034 | 4.030% | 4.030% | 75,000 | ||||||||||||||||||||||
| Secured Debt: | ||||||||||||||||||||||||||
| $60M Term Loan Facility |
10/27/2026(9)
|
SOFR+1.250%(9)
|
5.060%(10)
|
60,000 | ||||||||||||||||||||||
| 701-751 Kingshill Place | 1/5/2026 | 3.900% | 3.900% | 6,784 | ||||||||||||||||||||||
| 13943-13955 Balboa Boulevard | 7/1/2027 | 3.930% | 3.930% | 14,015 | ||||||||||||||||||||||
| 2205 126th Street | 12/1/2027 | 3.910% | 3.910% | 5,200 | ||||||||||||||||||||||
| 2410-2420 Santa Fe Avenue | 1/1/2028 | 3.700% | 3.700% | 10,300 | ||||||||||||||||||||||
| 11832-11954 La Cienega Boulevard | 7/1/2028 | 4.260% | 4.260% | 3,731 | ||||||||||||||||||||||
| 1100-1170 Gilbert Street (Gilbert/La Palma) | 3/1/2031 | 5.125% | 5.125% | 1,432 | ||||||||||||||||||||||
| 7817 Woodley Avenue | 8/1/2039 | 4.140% | 4.140% | 2,679 | ||||||||||||||||||||||
| Total Debt | 3.757% | $ | 3,379,141 | |||||||||||||||||||||||
Debt Composition: |
||||||||||||||||||||||||||||||||
| Category | Weighted Average Term Remaining (yrs) |
Stated Interest Rate | Effective Interest Rate | Balance | % of Total | |||||||||||||||||||||||||||
| Fixed | 3.7 | 3.757% (See Table Above) |
3.757% | $ | 3,379,141 | 100% | ||||||||||||||||||||||||||
| Variable | — | — | —% | $ | — | 0% | ||||||||||||||||||||||||||
| Secured | 2.5 | 4.589% | $ | 104,141 | 3% | |||||||||||||||||||||||||||
| Unsecured | 3.7 | 3.731% | $ | 3,275,000 | 97% | |||||||||||||||||||||||||||
*See footnotes on the following page*
|
Second Quarter 2025
Supplemental Financial Reporting Package
|
Page 18
|
|
||||||
Debt Summary (Continued).
|
||||||||
| (unaudited and dollars in thousands) | ||||||||
Debt Maturity Schedule(11):
|
||||||||||||||||||||||||||||||||
| Year | Secured |
Unsecured | Total | % Total |
Effective Interest Rate(1)
|
|||||||||||||||||||||||||||
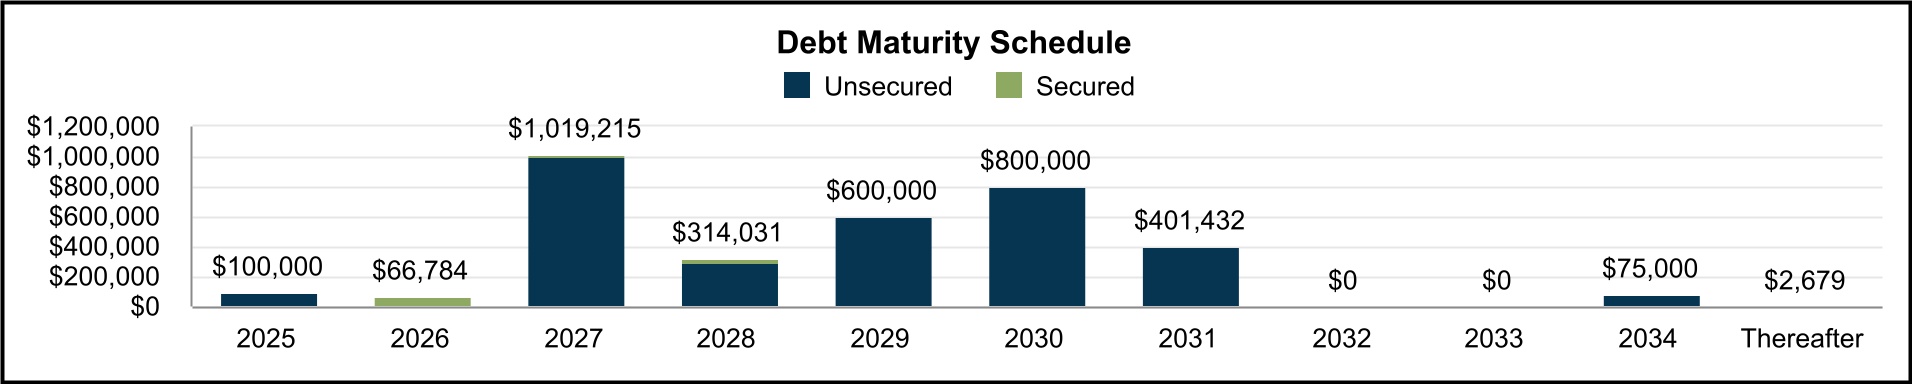
| 2025 | $ | — | $ | 100,000 | $ | 100,000 | 3 | % | 4.290 | % | ||||||||||||||||||||||
| 2026 | 66,784 | — | 66,784 | 2 | % | 4.942 | % | |||||||||||||||||||||||||
| 2027 | 19,215 | 1,000,000 | 1,019,215 | 30 | % | 4.118 | % | |||||||||||||||||||||||||
| 2028 | 14,031 | 300,000 | 314,031 | 9 | % | 4.949 | % | |||||||||||||||||||||||||
| 2029 | — | 600,000 | 600,000 | 18 | % | 4.115 | % | |||||||||||||||||||||||||
| 2030 | — | 800,000 | 800,000 | 24 | % | 3.169 | % | |||||||||||||||||||||||||
| 2031 | 1,432 | 400,000 | 401,432 | 12 | % | 2.161 | % | |||||||||||||||||||||||||
| 2032 | — | — | — | — | % | — | % | |||||||||||||||||||||||||
| 2033 | — | — | — | — | % | — | % | |||||||||||||||||||||||||
| 2034 | — | 75,000 | 75,000 | 2 | % | 4.030 | % | |||||||||||||||||||||||||
| Thereafter | 2,679 | — | 2,679 | 0 | % | 4.140 | % | |||||||||||||||||||||||||
| Total | $ | 104,141 | $ | 3,275,000 | $ | 3,379,141 | 100 | % | 3.757 | % | ||||||||||||||||||||||
(1)Includes the effect of interest rate swaps that were active as of June 30, 2025, including the interest rate swaps with a combined notional value of $400M that were executed on June 30, 2025 with an effective date of July 1, 2025. See notes (6), (8) & (10) below. Excludes the effect of premiums/discounts, deferred loan costs and the credit facility fee.
(2)Excludes unamortized debt issuance costs, premiums and discounts aggregating $31.6 million as of June 30, 2025.
(3)The $1.25B revolving credit facility (the “Revolver”) is subject to a facility fee which is calculated as a percentage of the total commitment amount, regardless of usage. The facility fee ranges from 0.125% to 0.300% depending on our credit ratings. There are also two sustainability-linked pricing components that can periodically change the facility fee by -/+ 0.01% (or zero) depending on our achievement of the annual sustainability performance metric. The sustainability-linked pricing adjustment for the facility fee is currently zero.
(4)The Revolver has two six-month extensions, subject to certain terms and conditions.
(5)The interest rates on these loans are comprised of Daily SOFR for the Revolver and $400M term loan facility and 1M SOFR for the $300M term loan facility (plus a 0.10% SOFR adjustment for the $300M term loan facility), and an applicable margin ranging from 0.725% to 1.40% for the Revolver and 0.80% to 1.60% for the $300M and $400M term loan facilities depending on our credit ratings and leverage ratio. There is also a sustainability-linked pricing component that can periodically change the margin by -/+ 0.04% (or zero) depending on our achievement of the annual sustainability performance metric. The sustainability-linked pricing adjustment for the margin is currently zero.
(6)Noteholders have the right to exchange their notes upon the occurrence of certain events. Exchanges will be settled in cash or in a combination of cash and shares of our common stock, at our option.
(7)We effectively fixed 1M SOFR related to our $300M term loan facility at a weighted average rate of 2.81725%, commencing on July 27, 2022 through May 26, 2027, through the use of interest rate swaps. The all-in fixed rate on the $300M term loan facility is 3.717% after adding the SOFR adjustment, applicable margin and sustainability-related rate adjustment.
(8)We effectively fixed Daily SOFR related to our $400M term loan facility at a weighted average rate of 3.41375%, commencing on July 1, 2025 through May 30, 2030, through the use of three new interest rate swaps that we executed on June 30, 2025. These swaps take the place of the swaps that were previously in place from April 3, 2023 through June 30, 2025, which fixed Daily SOFR at 3.97231%. The all-in fixed rate of 4.214% disclosed in the table reflects the impact of the new swaps (assuming they were effective as of June 30, 2025) after adding the applicable margin and sustainability-related rate adjustment.
(9)The $60M term loan facility has interest-only payment terms (1M SOFR + 0.10% SOFR adjustment + margin of 1.250%) and three one-year extensions available at the borrower’s option, subject to certain terms & conditions. On July 11, 2025, we exercised the second extension option, extending the loan’s maturity date by one additional year to October 27, 2026, which has been reflected in the table.
(10)We effectively fixed 1M SOFR related to our $60M term loan facility at 3.710%, commencing on April 3, 2023 through July 30, 2026, through the use of an interest rate swap. The all-in fixed rate on the $60M term loan facility is 5.060% after adding the SOFR adjustment and applicable margin.
(11)Excludes potential exercise of extension options and excludes the effect of scheduled monthly principal payments on amortizing secured loans.
|
Second Quarter 2025
Supplemental Financial Reporting Package
|
Page 19
|
|
||||||
Operations.
|
||||||||
| Quarterly Results | ||||||||
|
Second Quarter 2025
Supplemental Financial Reporting Package
|
Page 20
|
|
||||||
Portfolio Overview.
|
||||||||
| At June 30, 2025 | (unaudited results) | |||||||
| Consolidated Portfolio: | ||||||||
| Rentable Square Feet | Ending Occupancy % |
In-Place ABR(3)
|
|||||||||||||||||||||||||||||||||||||||||||||||||||||||||||||||
| Market | # of Properties |
Same Property Portfolio |
Non-Same Property Portfolio |
Total Portfolio |
Same Property Portfolio |
Non-Same Property Portfolio |
Total
Portfolio(1)
|
Total Portfolio
Excluding
Repo/Redev(2)
|
Total (in 000’s) |
Per Square Foot |
|||||||||||||||||||||||||||||||||||||||||||||||||||||||
| Central LA | 21 | 2,803,152 | 451,803 | 3,254,955 | 96.2 | % | 61.7 | % | 91.4 | % | 99.0 | % | $ | 40,126 | $13.49 | ||||||||||||||||||||||||||||||||||||||||||||||||||
| Greater San Fernando Valley | 74 | 5,485,235 | 1,698,421 | 7,183,656 | 96.3 | % | 64.5 | % | 88.8 | % | 96.4 | % | 110,490 | $17.32 | |||||||||||||||||||||||||||||||||||||||||||||||||||
| Mid-Counties | 39 | 2,984,698 | 1,669,792 | 4,654,490 | 98.8 | % | 67.9 | % | 87.7 | % | 98.8 | % | 68,519 | $16.78 | |||||||||||||||||||||||||||||||||||||||||||||||||||
| San Gabriel Valley | 47 | 3,407,578 | 2,642,777 | 6,050,355 | 93.4 | % | 66.8 | % | 81.8 | % | 86.1 | % | 70,825 | $14.32 | |||||||||||||||||||||||||||||||||||||||||||||||||||
| South Bay | 81 | 6,303,325 | 1,573,663 | 7,876,988 | 96.9 | % | 64.0 | % | 90.3 | % | 97.7 | % | 162,544 | $22.84 | |||||||||||||||||||||||||||||||||||||||||||||||||||
| Los Angeles County | 262 | 20,983,988 | 8,036,456 | 29,020,444 | 96.4 | % | 65.7 | % | 87.9 | % | 95.2 | % | 452,504 | $17.75 | |||||||||||||||||||||||||||||||||||||||||||||||||||
| North Orange County | 25 | 1,094,646 | 1,580,440 | 2,675,086 | 97.9 | % | 75.0 | % | 84.4 | % | 92.6 | % | 43,378 | $19.21 | |||||||||||||||||||||||||||||||||||||||||||||||||||
| OC Airport | 10 | 1,099,985 | 106,604 | 1,206,589 | 99.2 | % | 100.0 | % | 99.3 | % | 99.3 | % | 23,309 | $19.46 | |||||||||||||||||||||||||||||||||||||||||||||||||||
| South Orange County | 9 | 346,463 | 183,098 | 529,561 | 100.0 | % | 88.9 | % | 96.2 | % | 100.0 | % | 8,796 | $17.27 | |||||||||||||||||||||||||||||||||||||||||||||||||||
| West Orange County | 10 | 852,079 | 436,759 | 1,288,838 | 100.0 | % | 81.0 | % | 93.6 | % | 98.1 | % | 19,929 | $16.52 | |||||||||||||||||||||||||||||||||||||||||||||||||||
| Orange County | 54 | 3,393,173 | 2,306,901 | 5,700,074 | 99.1 | % | 78.4 | % | 90.7 | % | 96.1 | % | 95,412 | $18.45 | |||||||||||||||||||||||||||||||||||||||||||||||||||
| Inland Empire East | 1 | 33,258 | — | 33,258 | 100.0 | % | — | % | 100.0 | % | 100.0 | % | 660 | $19.86 | |||||||||||||||||||||||||||||||||||||||||||||||||||
| Inland Empire West | 53 | 8,490,725 | 1,051,523 | 9,542,248 | 95.5 | % | 80.9 | % | 93.9 | % | 95.9 | % | 136,550 | $15.25 | |||||||||||||||||||||||||||||||||||||||||||||||||||
| Riverside / San Bernardino County | 54 | 8,523,983 | 1,051,523 | 9,575,506 | 95.5 | % | 80.9 | % | 93.9 | % | 96.0 | % | 137,210 | $15.27 | |||||||||||||||||||||||||||||||||||||||||||||||||||
| Central San Diego | 21 | 1,349,009 | 779,311 | 2,128,320 | 98.8 | % | 51.8 | % | 81.6 | % | 90.9 | % | 36,280 | $20.89 | |||||||||||||||||||||||||||||||||||||||||||||||||||
| North County San Diego | 13 | 1,230,247 | 143,663 | 1,373,910 | 94.1 | % | 100.0 | % | 94.7 | % | 94.7 | % | 19,565 | $15.04 | |||||||||||||||||||||||||||||||||||||||||||||||||||
| San Diego County | 34 | 2,579,256 | 922,974 | 3,502,230 | 96.5 | % | 59.3 | % | 86.7 | % | 92.5 | % | 55,845 | $18.39 | |||||||||||||||||||||||||||||||||||||||||||||||||||
| Ventura | 18 | 2,510,848 | 712,795 | 3,223,643 | 91.5 | % | 73.4 | % | 87.5 | % | 90.9 | % | 37,858 | $13.42 | |||||||||||||||||||||||||||||||||||||||||||||||||||
| Ventura County | 18 | 2,510,848 | 712,795 | 3,223,643 | 91.5 | % | 73.4 | % | 87.5 | % | 90.9 | % | 37,858 | $13.42 | |||||||||||||||||||||||||||||||||||||||||||||||||||
| CONSOLIDATED TOTAL / WTD AVG | 422 | 37,991,248 | 13,030,649 | 51,021,897 | 96.1 | % | 69.1 | % | 89.2 | % | 95.0 | % | $ | 778,829 | $17.11 | (4) |
|||||||||||||||||||||||||||||||||||||||||||||||||
(1)See page 38 for historical occupancy by County.
(2)Excludes space aggregating 3,094,182 square feet at our properties that were in various stages of repositioning, redevelopment or lease-up as of June 30, 2025. See pages 26-31 for additional details on these properties.
(3)See page 34 for definitions and details on how these amounts are calculated.
(4)Excluding in-place ABR associated with Land/IOS properties ($45.349M) and cellular tower, solar and parking lot leases ($2.698M ABR), in-place building ABR per building SF was $16.14.
|
Second Quarter 2025
Supplemental Financial Reporting Package
|
Page 21
|
|
||||||
Executed Leasing Statistics and Trends.
|
||||||||
| (unaudited results) | ||||||||
| Executed Leasing Activity and Weighted Average New / Renewal Leasing Spreads: | ||||||||
| Three Months Ended | ||||||||||||||||||||||||||||||||
| Jun 30, 2025 | Mar 31, 2025 | Dec 31, 2024 | Sep 30, 2024 | Jun 30, 2024 | ||||||||||||||||||||||||||||
| Leasing Spreads: | ||||||||||||||||||||||||||||||||
| Net Effective Rent Change | 20.9 | % | 23.8 | % | 55.4 | % | 39.2 | % | 67.7 | % | ||||||||||||||||||||||
| Cash Rent Change | 8.1 | % | 14.7 | % | 41.0 | % | 26.7 | % | 49.0 | % | ||||||||||||||||||||||
Leasing Activity (Building SF):(1)(2)
|
||||||||||||||||||||||||||||||||
| New leases | 678,727 | 882,403 | 330,334 | 994,566 | 1,033,006 | |||||||||||||||||||||||||||
| Renewal leases | 1,020,266 | 1,511,946 | 684,961 | 599,529 | 1,228,905 | |||||||||||||||||||||||||||
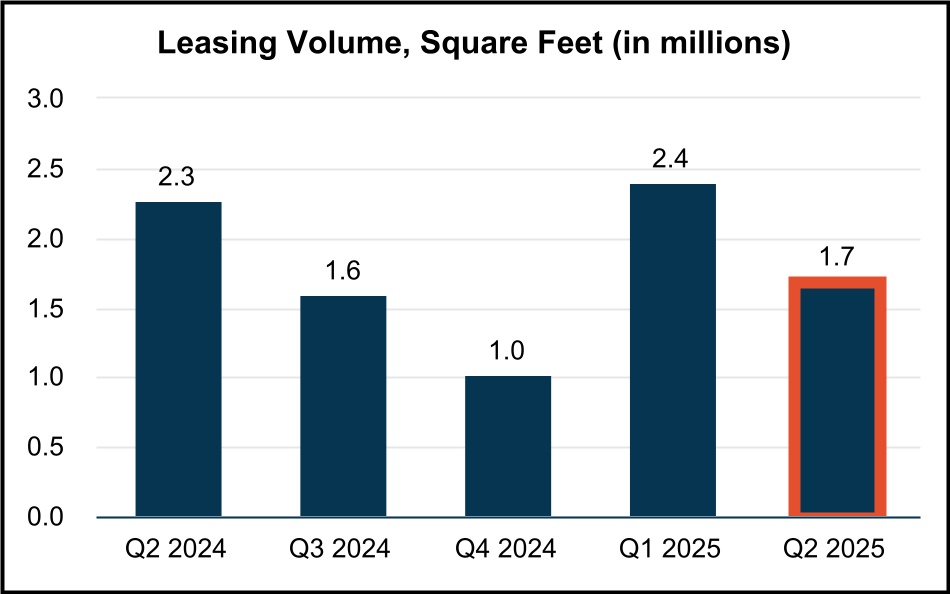
| Total leasing activity | 1,698,993 | 2,394,349 | 1,015,295 | 1,594,095 | 2,261,911 | |||||||||||||||||||||||||||
| Total expiring leases | (1,786,814) | (3,102,514) | (2,436,160) | (1,677,064) | (2,038,430) | |||||||||||||||||||||||||||
| Expiring leases - placed into repositioning/redevelopment | 304,776 | 833,218 | 996,035 | 476,821 | 175,533 | |||||||||||||||||||||||||||
Net absorption(3)
|
216,955 | 125,053 | (424,830) | 393,852 | 399,014 | |||||||||||||||||||||||||||
Retention rate(4)
|
69 | % | 68 | % | 51 | % | 52 | % | 68 | % | ||||||||||||||||||||||
Retention + Backfill rate(5)
|
74 | % | 82 | % | 62 | % | 72 | % | 80 | % | ||||||||||||||||||||||
Executed Leasing Activity and Change in Annual Rental Rates and Turnover Costs for Current Quarter Leases:(6)
|
||||||||||||||||||||||||||||||||||||||||||||||||||||||||||||||||||||||||||
Net Effective Rent |
Cash Rent |
Turnover Costs(8)
|
||||||||||||||||||||||||||||||||||||||||||||||||||||||||||||||||||||||||
| Second Quarter 2025: | # Leases Signed |
SF of Leasing |
Wtd. Avg. Lease Term (Years) |
Current Lease |
Prior Lease |
Rent Change |
Current Lease |
Prior Lease |
Rent Change |
Wtd. Avg. Abatement (Months) |
Tenant
Improvements
per SF
|
Leasing
Commissions
per SF
|
||||||||||||||||||||||||||||||||||||||||||||||||||||||||||||||
New(7)
|
41 | 678,727 | 4.8 | $15.31 | $18.57 | (17.6)% | $15.46 | $20.05 | (22.9)% | 4.0 | $2.42 | $4.16 | ||||||||||||||||||||||||||||||||||||||||||||||||||||||||||||||
| Renewal | 58 | 1,020,266 | 4.2 | $17.49 | $13.33 | 31.2% | $17.11 | $14.72 | 16.3% | 2.2 | $0.54 | $2.40 | ||||||||||||||||||||||||||||||||||||||||||||||||||||||||||||||
| Total / Wtd. Average | 99 | 1,698,993 | 4.5 | $17.14 | $14.18 | 20.9% | $16.85 | $15.58 | 8.1% | 2.5 | $0.85 | $2.68 | ||||||||||||||||||||||||||||||||||||||||||||||||||||||||||||||
(1)Represents all executed leases, including those in our Repositioning, Redevelopment, or “Other Repositioning” classifications, but excludes month-to-month tenants and leases with terms less than 12 months.
(2)Leasing activity for Q2-2025 excludes the following land lease activity: (i) one new land lease deal with 14,370 land SF and (ii) three renewal land lease deals with a combined 292,870 land SF and (iii) three expiring land leases with 292,870 land SF. The weighted average net effective rent and cash rent changes for the three renewal land leases were 110.3% and 25.6%, respectively. The one new lease did not have any comparable lease data.
(3)Net absorption represents total leasing activity, less expiring leases adjusted for square footage placed into Repositioning, Redevelopment or “Other Repositioning.”
(4)Retention rate is calculated as renewal lease square footage plus relocation/expansion square footage, divided by expiring lease square footage. Retention excludes square footage related to the following: (i) expiring leases associated with space that is placed into repositioning/redevelopment (including “Other Repositioning” projects) after the tenant vacates, (ii) early terminations with prenegotiated replacement leases and (iii) move outs where space is directly leased by subtenants.
(5)Retention + Backfill rate represents square feet retained (per Retention rate definition in footnote (4)) plus the square footage of move outs in the quarter which were re-leased prior to or during the same quarter, divided by expiring lease square footage.
(6)Net effective and cash rent statistics and turnover costs exclude 43 new leases aggregating 482,297 RSF for which there was no comparable lease data. Comparable leases generally exclude: (i) space that has never been occupied under our ownership, (ii) repositioned/redeveloped space, including space in pre-development/entitlement process, (iii) space that has been vacant for greater than 1 year or (iv) lease terms less than 12 months. Net effective and cash rent statistics and turnover costs for building leases also exclude land lease deals noted in footnote (2) above.
(7)The net effective and cash releasing spreads for new leases were disproportionately impacted by a 106,251-square-foot lease with a net effective and cash releasing spread of (31.6%) and (36.9%), respectively. This lease represented approximately 54% of the 196,430 square feet of comparable new leases signed during the quarter. Excluding this lease, net effective and cash releasing spreads for new leases would have been (0.5%) and 4.2%, respectively.
(8)Turnover costs include estimated tenant improvement and leasing costs associated with leases executed during the current period. Excludes costs for 1st generation leases.
|
Second Quarter 2025
Supplemental Financial Reporting Package
|
Page 22
|
|
||||||
Leasing Statistics (Continued).
|
||||||||
| (unaudited results) | ||||||||
| Lease Expiration Schedule as of June 30, 2025: | ||||||||
| Year of Lease Expiration | # of Leases Expiring |
Total Rentable Square Feet |
In-Place + Uncommenced ABR (in thousands) |
In-Place + Uncommenced ABR per SF |
||||||||||||||||||||||
| Available | — | 2,335,464 | $ | — | $— | |||||||||||||||||||||
Repositioning/Redevelopment(1)
|
— | 2,871,961 | — | $— | ||||||||||||||||||||||
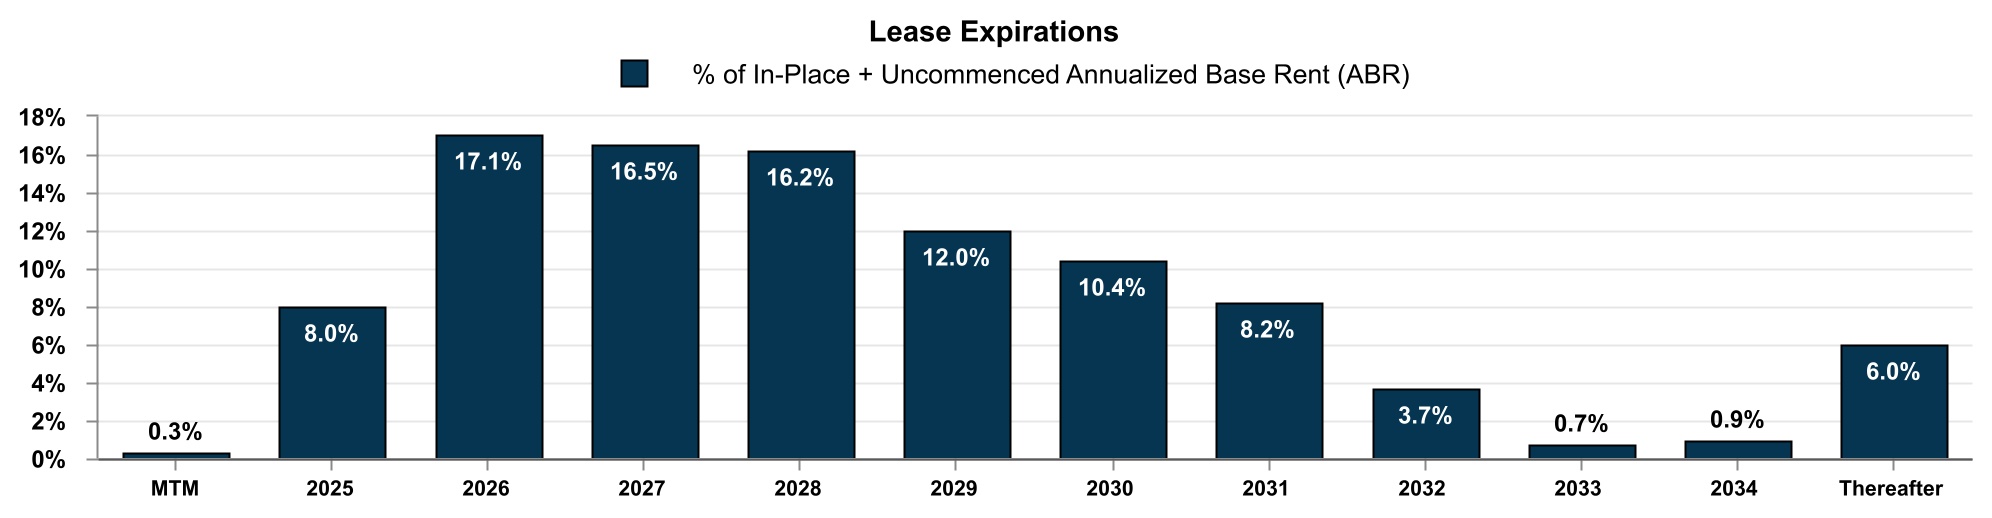
| MTM Tenants | 4 | 131,415 | 2,172 | $16.53 | ||||||||||||||||||||||
| 2025 | 194 | 4,122,156 | 62,790 | $15.23 | ||||||||||||||||||||||
| 2026 | 420 | 8,657,602 | 134,289 | $15.51 | ||||||||||||||||||||||
| 2027 | 343 | 7,439,877 | 129,504 | $17.41 | ||||||||||||||||||||||
| 2028 | 252 | 6,753,145 | 126,904 | $18.79 | ||||||||||||||||||||||
| 2029 | 168 | 4,958,782 | 94,085 | $18.97 | ||||||||||||||||||||||
| 2030 | 119 | 5,079,934 | 81,958 | $16.13 | ||||||||||||||||||||||
| 2031 | 38 | 4,408,532 | 64,651 | $14.66 | ||||||||||||||||||||||
| 2032 | 23 | 1,392,533 | 28,229 | $20.27 | ||||||||||||||||||||||
| 2033 | 9 | 296,735 | 5,832 | $19.66 | ||||||||||||||||||||||
| 2034 | 7 | 355,445 | 6,980 | $19.64 | ||||||||||||||||||||||
| Thereafter | 36 | 2,218,316 | 46,943 | $21.16 | ||||||||||||||||||||||
| Total Portfolio | 1,613 | 51,021,897 | $ | 784,337 |
$17.12(2)
|
|||||||||||||||||||||
(1)Represents vacant space at properties that were classified as repositioning (including “Other Repositionings”), redevelopment or lease-up as of June 30, 2025. See pages 26-31 for additional details on these properties.
(2)Excluding in-place + uncommenced ABR associated with Land/IOS properties ($45.349M) and cellular tower, solar and parking lot leases ($2.698M ABR), in-place + uncommenced ABR per building SF was $16.15.
|
Second Quarter 2025
Supplemental Financial Reporting Package
|
Page 23
|
|
||||||
Top Tenants and Lease Segmentation.
|
||||||||
| (unaudited results) | ||||||||
Top 20 Tenants as of June 30, 2025 |
||||||||
| Tenant | Submarket | Leased Rentable SF |
In-Place + Uncommenced
ABR (in 000’s)(1)
|
% of In-Place +
Uncommenced ABR(1)
|
In-Place + Uncommenced
ABR per SF(1)
|
Lease Expiration |
||||||||||||||||||||||||||||||||
| Tireco, Inc. | Inland Empire West | 1,101,840 | $19,251 | 2.5% | $17.47 | 1/31/2027 | ||||||||||||||||||||||||||||||||
| L3 Technologies, Inc. |
Multiple Submarkets(2)
|
595,267 | $12,967 | 1.6% | $21.78 | 9/30/2031 | ||||||||||||||||||||||||||||||||
| Zenith Energy West Coast Terminals LLC | South Bay |
—(3)
|
$11,675 | 1.5% |
$3.34(3)
|
9/29/2041 | ||||||||||||||||||||||||||||||||
| Cubic Corporation | Central San Diego | 515,382 | $11,443 | 1.5% | $22.20 |
3/31/2038(4)
|
||||||||||||||||||||||||||||||||
| IBY, LLC | San Gabriel Valley | 1,178,021 | $11,322 | 1.4% | $9.61 |
4/5/2031(5)
|
||||||||||||||||||||||||||||||||
| Federal Express Corporation |
Multiple Submarkets(6)
|
527,861 | $10,397 | 1.3% | $19.70 |
11/30/2032(6)
|
||||||||||||||||||||||||||||||||
| GXO Logistics Supply Chain, Inc. | Mid-Counties | 411,034 | $9,076 | 1.2% | $22.08 | 11/30/2028 | ||||||||||||||||||||||||||||||||
| Best Buy Stores, L.P. | Inland Empire West | 501,649 | $8,871 | 1.1% | $17.68 | 6/30/2029 | ||||||||||||||||||||||||||||||||
| The Hertz Corporation | South Bay |
38,680(7)
|
$8,579 | 1.1% |
$10.71(7)
|
3/31/2026 | ||||||||||||||||||||||||||||||||
| Orora Packaging Solutions |
Multiple Submarkets(8)
|
476,065 | $7,845 | 1.0% | $16.48 |
9/30/2028(8)
|
||||||||||||||||||||||||||||||||
| Top 10 Tenants | 5,345,799 | $111,426 | 14.2% | |||||||||||||||||||||||||||||||||||
| Top 11 - 20 Tenants | 3,155,041 | $50,785 | 6.5% | |||||||||||||||||||||||||||||||||||
| Total Top 20 Tenants | 8,500,840 | $162,211 | 20.7% | |||||||||||||||||||||||||||||||||||
(1)See page 34 for further details on how these amounts are calculated.
(2)Includes (i) 133,836 RSF in North Orange County expiring Dec 31, 2025 and (ii) 461,431 RSF in LA-South Bay expiring Sep 30, 2031.
(3)The tenant is leasing an 80.2 acre industrial outdoor storage site with ABR of $11.7 million or $3.34 per land square foot.
(4)Includes (i) 200,155 RSF expiring Sep 30, 2025 and (ii) 315,227 RSF expiring Mar 31, 2038.
(5)Includes (i) 184,879 RSF expiring Apr 30, 2028 and (ii) 993,142 RSF expiring Apr 5, 2031.
(6)Includes (i) one land lease in LA-Mid-Counties expiring Jun 30, 2029, (ii) one land lease in North Orange County expiring Oct 31, 2026, (iii) 30,160 RSF in Ventura expiring Sep 30, 2027, (iv) one land lease in LA-Mid-Counties expiring Jun 30, 2029, (v) 42,270 RSF in LA-South Bay expiring Oct 31, 2030, (vi) 311,995 RSF in North County San Diego expiring Feb 28, 2031, & (vii) 143,436 RSF in LA-South Bay expiring Nov 30, 2032.
(7)The tenant is leasing 18.4 acres of land with ABR of $8.6 million or $10.71 per land square foot.
(8)Includes (i) 96,993 RSF in North County San Diego expiring Sep 30, 2026, (ii) 100,500 RSF in the Greater San Fernando Valley expiring Sep 30, 2027 and (iii) 278,572 RSF in North OC expiring Sep 30, 2028.
| Lease Segmentation by Size: | |||||||||||||||||||||||||||||||||||||||||||||||||||||
| Square Feet | Number of Leases |
Leased Building/Land Rentable SF |
Building/Land Rentable SF |
Leased % | Building Leased % Excl. Repo/Redev |
In-Place +
Uncommenced ABR
(in 000’s)(1)
|
% of In-Place +
Uncommenced
ABR(1)
|
In-Place +
Uncommenced
ABR per SF(1)
|
|||||||||||||||||||||||||||||||||||||||||||||
| Building: | |||||||||||||||||||||||||||||||||||||||||||||||||||||
| <4,999 | 581 | 1,394,063 | 1,518,894 | 91.8% | 92.2% | $ | 27,745 | 3.5% | $19.90 | ||||||||||||||||||||||||||||||||||||||||||||
| 5,000 - 9,999 | 229 | 1,637,021 | 1,764,705 | 92.8% | 96.1% | 31,328 | 4.0% | $19.14 | |||||||||||||||||||||||||||||||||||||||||||||
| 10,000 - 24,999 | 320 | 5,170,067 | 5,977,246 | 86.5% | 91.9% | 97,060 | 12.4% | $18.77 | |||||||||||||||||||||||||||||||||||||||||||||
| 25,000 - 49,999 | 171 | 6,298,392 | 7,313,147 | 86.1% | 93.0% | 110,224 | 14.1% | $17.50 | |||||||||||||||||||||||||||||||||||||||||||||
| 50,000 - 99,999 | 117 | 8,487,559 | 9,611,435 | 88.3% | 96.2% | 144,345 | 18.4% | $17.01 | |||||||||||||||||||||||||||||||||||||||||||||
| >100,000 | 121 | 22,596,692 | 24,587,930 | 91.9% | 96.2% | 325,588 | 41.5% | $14.41 | |||||||||||||||||||||||||||||||||||||||||||||
| Building Subtotal / Wtd. Avg. | 1,539 | 45,583,794 | (2) |
50,773,357 | (2) |
89.8% | (2) |
95.1% | $ | 736,290 | 93.9% | $16.15 | |||||||||||||||||||||||||||||||||||||||||
Land/IOS(3)
|
27 | 8,361,189 | (4) |
8,544,650 | (4) |
97.9% | 45,349 | 5.8% | $5.31 | (4) |
|||||||||||||||||||||||||||||||||||||||||||
Other(3)
|
47 | 2,698 | 0.3% | ||||||||||||||||||||||||||||||||||||||||||||||||||
| Total | 1,613 | $ | 784,337 | 100.0% | |||||||||||||||||||||||||||||||||||||||||||||||||
(1)See page 34 for further details on how these amounts are calculated.
(2)Excludes 230,678 leased building RSF that are associated with “Land/IOS.” Including this RSF, total portfolio is 89.8% leased.
(3)“Land/IOS” includes leases for improved land sites and industrial outdoor storage (IOS) sites. “Other” includes amounts related to cellular tower, solar and parking lot leases.
(4)Represents leased land square feet, available land square feet, land leased percentage and ABR per land square foot associated with Land/IOS leases.
|
Second Quarter 2025
Supplemental Financial Reporting Package
|
Page 24
|
|
||||||
Capital Expenditure Summary.
|
||||||||
| (unaudited results, in thousands, except square feet and per square foot data) | ||||||||
| Six months ended June 30, 2025 | ||||||||
| Year to Date | ||||||||||||||||||||||||||||||||
| Q2-2025 | Q1-2025 | Total |
SF(1)
|
PSF | ||||||||||||||||||||||||||||
| Tenant Improvements: | ||||||||||||||||||||||||||||||||
| New Leases – 1st Generation | $ | 292 | $ | 798 | $ | 1,090 | 534,316 | $ | 2.04 | |||||||||||||||||||||||
| New Leases – 2nd Generation | 641 | 4 | 645 | 392,438 | $ | 1.64 | ||||||||||||||||||||||||||
| Renewals | 22 | 158 | 180 | 399,763 | $ | 0.45 | ||||||||||||||||||||||||||
| Total Tenant Improvements | $ | 955 | $ | 960 | $ | 1,915 | ||||||||||||||||||||||||||
| Leasing Commissions & Lease Costs: | ||||||||||||||||||||||||||||||||
| New Leases – 1st Generation | $ | 1,879 | $ | 3,058 | $ | 4,937 | 909,270 | $ | 5.43 | |||||||||||||||||||||||
| New Leases – 2nd Generation | 1,258 | 1,886 | 3,144 | 800,457 | $ | 3.93 | ||||||||||||||||||||||||||
| Renewals | 2,904 | 2,993 | 5,897 | 3,135,150 | $ | 1.88 | ||||||||||||||||||||||||||
| Total Leasing Commissions & Lease Costs | $ | 6,041 | $ | 7,937 | $ | 13,978 | ||||||||||||||||||||||||||
| Total Recurring Capex | $ | 5,887 | $ | 1,311 | $ | 7,198 | 51,135,876 | $ | 0.14 | |||||||||||||||||||||||
| Recurring Capex % of NOI | 3.2 | % | 0.7 | % | 1.9 | % | ||||||||||||||||||||||||||
| Recurring Capex % of Rental Income | 2.4 | % | 0.5 | % | 1.5 | % | ||||||||||||||||||||||||||
| Nonrecurring Capex: | ||||||||||||||||||||||||||||||||
Repositioning and Redevelopment in Process(2)
|
$ | 61,491 | $ | 39,455 | $ | 100,946 | ||||||||||||||||||||||||||
Unit Renovation(3)
|
1,452 | 2,910 | 4,362 | |||||||||||||||||||||||||||||
Other(4)
|
2,433 | 996 | 3,429 | |||||||||||||||||||||||||||||
| Total Nonrecurring Capex | $ | 65,376 | $ | 43,361 | $ | 108,737 | 35,559,133 | $ | 3.06 | |||||||||||||||||||||||
Other Capitalized Costs(5)
|
$ | 14,814 | $ | 13,644 | $ | 28,458 | ||||||||||||||||||||||||||
(1)For tenant improvements and leasing commissions, reflects the aggregate square footage of the leases in which we incurred such costs, excluding new/renewal leases in which there were no tenant improvements and/or leasing commissions. For recurring capex, reflects the weighted average square footage of our consolidated portfolio for the period (including properties that were sold during the period). For nonrecurring capex, reflects the aggregate square footage of the properties in which we incurred such capital expenditures.
(2)Includes capital expenditures related to properties that were under repositioning or redevelopment as of June 30, 2025. See pages 26-31 for details of these properties.
(3)Includes non-tenant-specific capital expenditures with costs of less than $100,000 per unit.
(4)Includes other nonrecurring capital expenditures including, but not limited to, seismic and fire sprinkler upgrades, replacements of either roof or parking lots, ADA related construction and capital expenditures for deferred maintenance existing at the time such property was acquired.
(5)Includes the following capitalized costs: (i) compensation costs of personnel directly responsible for and who spend their time on redevelopment, renovation and rehabilitation activity and (ii) interest, property taxes and insurance costs incurred during the pre-development and construction periods of repositioning or redevelopment projects.
|
Second Quarter 2025
Supplemental Financial Reporting Package
|
Page 25
|
|
||||||
Properties and Space Under Repositioning/Redevelopment.(1)
| ||||||||
| As of June 30, 2025 | (unaudited results, $ in millions) | |||||||
| Repositioning | ||||||||||||||||||||||||||||||||||||||||||||||||||||||||||||||
|
Repo/
Lease-Up
RSF(2)
|
Repo RSF
Leased %
6/30/2025
|
Est. Constr. Period(1)
|
Purch.
Price(1)
|
Proj.
Repo
Costs(1)
|
Proj.
Total
Invest.(1)
|
Proj.
Remaining
Costs
|
||||||||||||||||||||||||||||||||||||||||||||||||||||||||
Property |
County |
Submarket |
Start | Target Complet. |
||||||||||||||||||||||||||||||||||||||||||||||||||||||||||
| CURRENT REPOSITIONING: | ||||||||||||||||||||||||||||||||||||||||||||||||||||||||||||||
19301 Santa Fe Avenue |
Los Angeles | South Bay |
LAND | —% | 2Q-24 | 3Q-25 | $ | 14.7 | $ | 5.7 | $ | 20.4 | $ | 0.8 | ||||||||||||||||||||||||||||||||||||||||||||||||
Harcourt & Susana |
Los Angeles | South Bay |
34,000 | —% | 2Q-24 | 3Q-25 | 54.4 | 11.0 | 65.4 | 2.0 | ||||||||||||||||||||||||||||||||||||||||||||||||||||
8985 Crestmar Point |
San Diego |
Central San Diego |
53,395 | —% | 4Q-24 | 3Q-25 | 8.1 | 5.5 | 13.6 | 1.2 | ||||||||||||||||||||||||||||||||||||||||||||||||||||
14955 Salt Lake Avenue |
Los Angeles | San Gabriel Valley |
45,930 | —% | 4Q-24 | 3Q-25 | 10.9 | 3.7 | 14.6 | 0.8 | ||||||||||||||||||||||||||||||||||||||||||||||||||||
9455 Cabot Drive |
San Diego |
Central San Diego |
83,563 | —% | 2Q-25 | 4Q-25 | 12.2 | 8.2 | 20.4 | 4.9 | ||||||||||||||||||||||||||||||||||||||||||||||||||||
14400 Figueroa Street (Figueroa & Rosecrans) |
Los Angeles | South Bay | 56,700 | —% | 2Q-25 | 3Q-26 | 61.4 | 13.1 | 74.5 | 11.5 | ||||||||||||||||||||||||||||||||||||||||||||||||||||
Total |
273,588 | $ | 161.7 | $ | 47.2 | $ | 208.9 | $ | 21.2 | |||||||||||||||||||||||||||||||||||||||||||||||||||||
Actual Cash NOI - 2Q-2025 |
$0.4 | |||||||||||||||||||||||||||||||||||||||||||||||||||||||||||||
Estimated Annualized Stabilized Cash NOI |
$9.4 - $10.4 |
|||||||||||||||||||||||||||||||||||||||||||||||||||||||||||||
Estimated Unlevered Stabilized Yield |
4.5% - 5.0% |
|||||||||||||||||||||||||||||||||||||||||||||||||||||||||||||
|
Repo/
Lease-Up
RSF(2)
|
Repo RSF
Leased %
6/30/2025
|
Construction Period |
Purch.
Price(1)
|
Proj.
Repo
Costs(1)
|
Proj.
Total
Invest.(1)
|
Proj.
Remaining
Costs
|
||||||||||||||||||||||||||||||||||||||||||||||||||||||||
Property |
County |
Submarket |
Start | Complete |
||||||||||||||||||||||||||||||||||||||||||||||||||||||||||
| LEASE-UP REPOSITIONING: | ||||||||||||||||||||||||||||||||||||||||||||||||||||||||||||||
11308-11350 Penrose Street(3)
|
Los Angeles |
Greater San Fernando Valley | 71,547 | —% | 1Q-23 | 1Q-24 | $ | 12.1 | $ | 5.2 | $ | 17.3 | $ | 0.6 | ||||||||||||||||||||||||||||||||||||||||||||||||
14434-14527 San Pedro Street |
Los Angeles |
South Bay |
58,225 | —% | 3Q-23 | 1Q-25 | 49.8 | 14.7 | 64.5 | 0.6 | ||||||||||||||||||||||||||||||||||||||||||||||||||||
1020 Bixby Drive |
Los Angeles |
San Gabriel Valley | 57,600 |
100%(4)
|
1Q-24 | 3Q-24 | 16.5 | 3.0 | 19.5 | 0.3 | ||||||||||||||||||||||||||||||||||||||||||||||||||||
17000 Kingsview Avenue |
Los Angeles | South Bay |
95,865 | —% | 1Q-24 | 1Q-25 | 14.0 | 4.3 | 18.3 | 1.5 | ||||||||||||||||||||||||||||||||||||||||||||||||||||
1315 Storm Parkway |
Los Angeles |
South Bay | 37,844 | —% | 2Q-24 | 4Q-24 | 8.5 | 3.5 | 12.0 | 0.6 | ||||||||||||||||||||||||||||||||||||||||||||||||||||
Total |
321,081 | $ | 100.9 | $ | 30.7 | $ | 131.6 | $ | 3.6 | |||||||||||||||||||||||||||||||||||||||||||||||||||||
Actual Cash NOI - 2Q-2025 |
$(0.2) | |||||||||||||||||||||||||||||||||||||||||||||||||||||||||||||
| Estimated Annualized Stabilized Cash NOI | $6.3 - $6.9 |
|||||||||||||||||||||||||||||||||||||||||||||||||||||||||||||
| Estimated Unlevered Stabilized Yield | 4.75% - 5.25% |
|||||||||||||||||||||||||||||||||||||||||||||||||||||||||||||
— See numbered footnotes on page 31 —
|
Second Quarter 2025
Supplemental Financial Reporting Package
|
Page 26
|
|
||||||
Properties and Space Under Repositioning/Redevelopment (Continued).(1)
| ||||||||
| As of June 30, 2025 | (unaudited results, $ in millions) | |||||||
| Repositioning | ||||||||||||||||||||||||||||||||||||||||||||||||||||||||||||||
|
Repo/
Lease-Up
RSF(2)
|
Repo RSF
Leased %
6/30/2025
|
Construction Period |
Purch.
Price(1)
|
Proj.
Repo
Costs(1)
|
Proj.
Total
Invest.(1)
|
Proj.
Remaining
Costs
|
||||||||||||||||||||||||||||||||||||||||||||||||||||||||
Property |
County |
Submarket |
Start | Complete |
||||||||||||||||||||||||||||||||||||||||||||||||||||||||||
| STABILIZED REPOSITIONING: | ||||||||||||||||||||||||||||||||||||||||||||||||||||||||||||||
218 Turnbull Canyon Road |
Los Angeles | San Gabriel Valley | 191,153 | 100% | 1Q-25 | 2Q-25 | $ | 27.2 | $ | 3.3 | $ | 30.5 | $ | 0.4 | ||||||||||||||||||||||||||||||||||||||||||||||||
Total |
191,153 | $ | 27.2 | $ | 3.3 | $ | 30.5 | $ | 0.4 | |||||||||||||||||||||||||||||||||||||||||||||||||||||
Actual Cash NOI - 2Q-2025 |
$— | |||||||||||||||||||||||||||||||||||||||||||||||||||||||||||||
Annualized Stabilized Cash NOI |
$2.8 | |||||||||||||||||||||||||||||||||||||||||||||||||||||||||||||
Achieved Unlevered Stabilized Yield |
9.2% | |||||||||||||||||||||||||||||||||||||||||||||||||||||||||||||
| OTHER REPOSITIONING: | ||||||||||||||||||||||||||||||||||||||||||||||||||||||||||||||
25 projects totaling 1,140,095 RSF with estimated costs < $2 million individually(5)
|
$ | 33.3 | $ | 12.9 | ||||||||||||||||||||||||||||||||||||||||||||||||||||||||||
Actual Cash NOI - 2Q-2025 |
$1.1 | |||||||||||||||||||||||||||||||||||||||||||||||||||||||||||||
| Estimated Annualized Stabilized Cash NOI | $19.0 - $19.5 |
|||||||||||||||||||||||||||||||||||||||||||||||||||||||||||||
| Estimated Unlevered Stabilized Yield | 6.5% - 7.0% |
|||||||||||||||||||||||||||||||||||||||||||||||||||||||||||||
— See numbered footnotes on page 31 —
|
Second Quarter 2025
Supplemental Financial Reporting Package
|
Page 27
|
|
||||||
Properties and Space Under Repositioning/Redevelopment (Continued).(1)
| ||||||||
| As of June 30, 2025 | (unaudited results, $ in millions) | |||||||
| Redevelopment | ||||||||||||||||||||||||||||||||||||||||||||||||||||||||||||||
|
Projected
RSF(6)
|
Property
Leased %
6/30/2025
|
Est. Constr. Period(1)
|
Purch.
Price(1)
|
Proj.
Redev
Costs(1)
|
Proj.
Total
Invest.(1)
|
Proj.
Remaining
Costs
|
||||||||||||||||||||||||||||||||||||||||||||||||||||||||
Property |
County |
Submarket |
Start | Target Complet. |
||||||||||||||||||||||||||||||||||||||||||||||||||||||||||
| CURRENT REDEVELOPMENT: | ||||||||||||||||||||||||||||||||||||||||||||||||||||||||||||||
9615 Norwalk Boulevard |
Los Angeles |
Mid-Counties |
201,571 | —% | 3Q-21 | 3Q-25 | $ | 9.6 | $ | 50.7 | $ | 60.3 | $ | 7.0 | ||||||||||||||||||||||||||||||||||||||||||||||||
15010 Don Julian Road |
Los Angeles | San Gabriel Valley | 219,242 | —% | 1Q-23 | 4Q-25 | 22.9 | 37.8 | 60.7 | 14.6 | ||||||||||||||||||||||||||||||||||||||||||||||||||||
21515 Western Avenue |
Los Angeles | South Bay |
83,740 | —% | 2Q-23 | 3Q-25 | 19.1 | 19.3 | 38.4 | 3.6 | ||||||||||||||||||||||||||||||||||||||||||||||||||||
14940 Proctor Road |
Los Angeles | San Gabriel Valley | 160,045 | —% | 4Q-24 | 2Q-26 | 28.8 | 26.2 | 55.0 | 14.4 | ||||||||||||||||||||||||||||||||||||||||||||||||||||
| 11234 Rush Street | Los Angeles | San Gabriel Valley | 103,108 | —% | 4Q-24 | 4Q-26 | 12.6 | 21.0 | 33.6 | 17.5 | ||||||||||||||||||||||||||||||||||||||||||||||||||||
| 5235 Hunter Avenue | Orange | North Orange County |
117,772 | —% | 1Q-25 | 3Q-26 | 11.4 | 20.2 | 31.6 | 16.0 | ||||||||||||||||||||||||||||||||||||||||||||||||||||
| 3547-3555 Voyager Street | Los Angeles | South Bay | 67,371 | —% | 1Q-25 | 3Q-26 | 21.1 | 18.8 | 39.9 | 16.7 | ||||||||||||||||||||||||||||||||||||||||||||||||||||
7815 Van Nuys Boulevard |
Los Angeles |
Greater San Fernando Valley |
78,990 | —% | 2Q-25 | 2Q-27 | 25.6 | 16.0 | 41.6 | 15.2 | ||||||||||||||||||||||||||||||||||||||||||||||||||||
Total |
1,031,839 | $ | 151.1 | $ | 210.0 | $ | 361.1 | $ | 105.0 | |||||||||||||||||||||||||||||||||||||||||||||||||||||
Actual Cash NOI - 2Q-2025 |
$— | |||||||||||||||||||||||||||||||||||||||||||||||||||||||||||||
| Estimated Annualized Stabilized Cash NOI | $19.0 - $20.8 | |||||||||||||||||||||||||||||||||||||||||||||||||||||||||||||
| Estimated Unlevered Stabilized Yield | 5.25% - 5.75% |
|||||||||||||||||||||||||||||||||||||||||||||||||||||||||||||
|
RSF
|
Property
Leased %
6/30/2025
|
Construction Period |
Purch.
Price(1)
|
Proj.
Redev
Costs(1)
|
Proj.
Total
Invest.(1)
|
Proj.
Remaining
Costs
|
||||||||||||||||||||||||||||||||||||||||||||||||||||||||
Property |
County |
Submarket |
Start | Complete |
||||||||||||||||||||||||||||||||||||||||||||||||||||||||||
| LEASE-UP REDEVELOPMENT: | ||||||||||||||||||||||||||||||||||||||||||||||||||||||||||||||
| 9920-10020 Pioneer Boulevard | Los Angeles | Mid-Counties | 163,435 | 14% | 4Q-21 | 3Q-24 | $ | 23.6 | $ | 31.8 | $ | 55.4 | $ | 1.2 | ||||||||||||||||||||||||||||||||||||||||||||||||
3233 Mission Oaks Boulevard(7)
|
Ventura |
Ventura |
116,852 | 16% | 2Q-22 | 1Q-25 | 40.7 | 25.7 | 66.4 | 2.8 | ||||||||||||||||||||||||||||||||||||||||||||||||||||
8888 Balboa Avenue |
San Diego |
Central San Diego |
123,492 |
100%(8)
|
3Q-22 | 4Q-24 | 19.9 | 22.8 | 42.7 | 1.1 | ||||||||||||||||||||||||||||||||||||||||||||||||||||
6027 Eastern Avenue |
Los Angeles |
Central LA |
94,140 | —% | 3Q-22 | 1Q-25 | 23.4 | 21.6 | 45.0 | 1.0 | ||||||||||||||||||||||||||||||||||||||||||||||||||||
2390-2444 American Way |
Orange | North Orange County |
100,483 | 48% | 4Q-22 | 2Q-24 | 17.1 | 19.2 | 36.3 | 0.5 | ||||||||||||||||||||||||||||||||||||||||||||||||||||
12118 Bloomfield Avenue |
Los Angeles | Mid-Counties | 107,045 | —% | 4Q-22 | 1Q-25 | 16.7 | 20.0 | 36.7 | 1.2 | ||||||||||||||||||||||||||||||||||||||||||||||||||||
3071 Coronado Street(9)
|
Orange | North Orange County |
105,173 |
100%(9)
|
1Q-23 | 1Q-24 | 28.2 | 16.7 | 44.9 | 0.9 | ||||||||||||||||||||||||||||||||||||||||||||||||||||
19900 Plummer Street |
Los Angeles | Greater San Fernando Valley | 79,539 | —% | 3Q-23 | 1Q-25 | 15.5 | 15.8 | 31.3 | 1.7 | ||||||||||||||||||||||||||||||||||||||||||||||||||||
12772 San Fernando Road |
Los Angeles | Greater San Fernando Valley |
143,529 | —% | 3Q-23 | 1Q-25 | 22.1 | 22.6 | 44.7 | 2.6 | ||||||||||||||||||||||||||||||||||||||||||||||||||||
Rancho Pacifica - Building 5(10)
|
Los Angeles | South Bay | 76,553 | —% | 4Q-23 | 1Q-25 | 9.3 | 17.3 | 26.6 | 3.3 | ||||||||||||||||||||||||||||||||||||||||||||||||||||
1500 Raymond Avenue |
Orange | North Orange County |
136,218 | —% | 4Q-23 | 1Q-25 | 46.1 | 22.4 | 68.5 | 1.9 | ||||||||||||||||||||||||||||||||||||||||||||||||||||
4416 Azusa Canyon Road |
Los Angeles | San Gabriel Valley |
129,830 | —% | 4Q-22 | 2Q-25 | 12.3 | 21.7 | 34.0 | 2.7 | ||||||||||||||||||||||||||||||||||||||||||||||||||||
17907-18001 Figueroa Street |
Los Angeles | South Bay | 76,468 | —% | 4Q-23 | 2Q-25 | 20.2 | 18.6 | 38.8 | 1.2 | ||||||||||||||||||||||||||||||||||||||||||||||||||||
Total |
1,452,757 | $ | 295.1 | $ | 276.2 | $ | 571.3 | $ | 22.1 | |||||||||||||||||||||||||||||||||||||||||||||||||||||
Actual Cash NOI - 2Q-2025 |
$0.4 | |||||||||||||||||||||||||||||||||||||||||||||||||||||||||||||
| Estimated Annualized Stabilized Cash NOI | $30.0 - $32.9 |
|||||||||||||||||||||||||||||||||||||||||||||||||||||||||||||
| Estimated Unlevered Stabilized Yield | 5.25% - 5.75% |
|||||||||||||||||||||||||||||||||||||||||||||||||||||||||||||
— See numbered footnotes on page 31 —
|
Second Quarter 2025
Supplemental Financial Reporting Package
|
Page 28
|
|
||||||
Properties and Space Under Repositioning/Redevelopment (Continued).(1)
| ||||||||
| As of June 30, 2025 | (unaudited results, $ in millions) | |||||||
Redevelopment |
||||||||||||||||||||||||||||||||||||||||||||||||||||||||||||||
|
RSF
|
Property
Leased %
6/30/2025
|
Construction Period |
Purch.
Price(1)
|
Proj.
Repo
Costs(1)
|
Proj.
Total
Invest.(1)
|
Proj.
Remaining
Costs
|
||||||||||||||||||||||||||||||||||||||||||||||||||||||||
Property |
County |
Submarket |
Start | Complete |
||||||||||||||||||||||||||||||||||||||||||||||||||||||||||
| STABILIZED REDEVELOPMENT: | ||||||||||||||||||||||||||||||||||||||||||||||||||||||||||||||
| 1901 Via Burton | Orange | North Orange County | 139,449 | 100% | 1Q-22 | 2Q-24 | $ | 24.5 | $ | 21.0 | $ | 45.5 | $ | — | ||||||||||||||||||||||||||||||||||||||||||||||||
Total |
139,449 | $ | 24.5 | $ | 21.0 | $ | 45.5 | $ | — | |||||||||||||||||||||||||||||||||||||||||||||||||||||
Actual Cash NOI - 2Q-2025 |
$0.2 | |||||||||||||||||||||||||||||||||||||||||||||||||||||||||||||
Annualized Stabilized Cash NOI |
$2.7 | |||||||||||||||||||||||||||||||||||||||||||||||||||||||||||||
Achieved Unlevered Stabilized Yield |
6.0% | |||||||||||||||||||||||||||||||||||||||||||||||||||||||||||||
— See numbered footnotes on page 31 —
|
Second Quarter 2025
Supplemental Financial Reporting Package
|
Page 29
|
|
||||||
Properties and Space Under Repositioning/Redevelopment (Continued).(1)
| ||||||||
| As of June 30, 2025 | (unaudited results, $ in millions) | |||||||
| Near-Term Potential Future Repositioning and Redevelopment | ||||||||||||||||||||||||||||||||
|
Projected
RSF(7)
|
||||||||||||||||||||||||||||||||
| Property | County | Submarket | Estimated Construction Start Period | Purchase Price | ||||||||||||||||||||||||||||
| FUTURE REPOSITIONING: | ||||||||||||||||||||||||||||||||
| 3935-3949 Heritage Oak Court | Ventura | Ventura | 186,726 | 2025 | $ | 56.7 | ||||||||||||||||||||||||||
| 1175 Aviation Place | Los Angeles | Greater San Fernando Valley | 93,219 | 2025 | $ | 5.8 | ||||||||||||||||||||||||||
| 24935 Avenue Kearny | Los Angeles | Greater San Fernando Valley | 69,761 | 2025 | $ | 17.9 | ||||||||||||||||||||||||||
| 1601 Mission Boulevard | Los Angeles | San Gabriel Valley | 504,016 | 2026 | $ | 87.9 | ||||||||||||||||||||||||||
| Total | 853,722 | |||||||||||||||||||||||||||||||
| Aggregate Projected Costs - Future Repositioning | $30.0 - $33.0 |
|||||||||||||||||||||||||||||||
Actual Cash NOI - 2Q-2025 |
$1.6 | |||||||||||||||||||||||||||||||
| FUTURE REDEVELOPMENT: | ||||||||||||||||||||||||||||||||
| 950 West 190th Street (Herbalife) | Los Angeles | South Bay | 197,000 | 2025 | $ | 41.5 | ||||||||||||||||||||||||||
| 9323 Balboa Avenue | San Diego | Central San Diego | 163,400 | 2025 | $ | 25.6 | ||||||||||||||||||||||||||
| 14005 Live Oak Avenue | Los Angeles | San Gabriel Valley | 100,380 | 2025 | $ | 27.1 | ||||||||||||||||||||||||||
| 3100 Fujita Street | Los Angeles | South Bay | 82,080 | 2025 | $ | 14.2 | ||||||||||||||||||||||||||
| 9000 Airport Road (Hertz) | Los Angeles | South Bay | 418,000 | 2026 | $ | 144.3 | ||||||||||||||||||||||||||
| 16425 Gale Avenue | Los Angeles | San Gabriel Valley | 325,800 | 2026 | $ | 26.3 | ||||||||||||||||||||||||||
| 2401-2421 Glassell Street | Orange | North Orange County | 277,000 | 2026 | $ | 70.4 | ||||||||||||||||||||||||||
| 600-708 Vermont Avenue | Orange | North Orange County | 263,800 | 2026 | $ | 57.2 | ||||||||||||||||||||||||||
| 18455 Figueroa Street | Los Angeles | South Bay | 179,284 | 2026 | $ | 65.7 | ||||||||||||||||||||||||||
| 15715 Arrow Highway | Los Angeles | San Gabriel Valley | 106,278 | 2026 | $ | 20.6 | ||||||||||||||||||||||||||
| 3901 Via Oro Avenue | Los Angeles | South Bay | 74,260 | 2026 | $ | 8.8 | ||||||||||||||||||||||||||
| Total | 2,187,282 | |||||||||||||||||||||||||||||||
| Total Future Repositioning/Redevelopment | 3,041,004 | |||||||||||||||||||||||||||||||
| Aggregate Projected Costs - Future Redevelopment | $355.0 - $385.0 |
|||||||||||||||||||||||||||||||
Actual Cash NOI - 2Q-2025 |
$6.4 | |||||||||||||||||||||||||||||||
— See numbered footnotes on page 31 —
|
Second Quarter 2025
Supplemental Financial Reporting Package
|
Page 30
|
|
||||||
|
Properties and Space Under Repositioning/Redevelopment (Continued).(1)
|
|||||||||||
| As of June 30, 2025 | (unaudited results, in thousands, except square feet) | ||||||||||
| Prior and Current Year Stabilized Repositioning/Redevelopment | ||||||||||||||||||||||||||||||||||||||||||||||||||||||||
| Property (Submarket) | Rentable Square Feet | Stabilized Period | Unlevered Stabilized Yield | |||||||||||||||||||||||||||||||||||||||||||||||||||||
| 9755 Distribution Avenue (Central SD) | 24,071 | 1Q-24 | 13.4% | |||||||||||||||||||||||||||||||||||||||||||||||||||||
| 8902-8940 Activity Road (Central SD) | 13,950 | 1Q-24 | 7.0% | |||||||||||||||||||||||||||||||||||||||||||||||||||||
| 444 Quay Avenue (South Bay) | 29,760 | 2Q-24 | 9.0% | |||||||||||||||||||||||||||||||||||||||||||||||||||||
| 263-321 Gardena Blvd (South Bay) | 55,238 | 2Q-24 | 10.3% | |||||||||||||||||||||||||||||||||||||||||||||||||||||
20851 Currier Road (SG Valley) |
59,412 | 3Q-24 | 4.7% | |||||||||||||||||||||||||||||||||||||||||||||||||||||
| 17311 Nichols Lane (West OC) | 104,182 | 3Q-24 | 8.2% | |||||||||||||||||||||||||||||||||||||||||||||||||||||
12752-12822 Monarch Street (West OC) |
163,864 | 3Q-24 | 8.6% | |||||||||||||||||||||||||||||||||||||||||||||||||||||
| 500 Dupont Avenue (Inland Empire West) | 274,885 | 4Q-24 | 5.5% | |||||||||||||||||||||||||||||||||||||||||||||||||||||
2880 Ana Street (South Bay) |
LAND |
4Q-24 | 4.3% | |||||||||||||||||||||||||||||||||||||||||||||||||||||
12907 Imperial Highway (Mid-Counties) |
101,080 | 4Q-24 | 14.3% | |||||||||||||||||||||||||||||||||||||||||||||||||||||
| 4039 Calle Platino (North County SD) | 73,807 | 1Q-25 | 8.5% | |||||||||||||||||||||||||||||||||||||||||||||||||||||
29120 Commerce Center Drive (SF Valley) |
135,258 | 1Q-25 | 8.5% | |||||||||||||||||||||||||||||||||||||||||||||||||||||
East 27th Street (Central LA) |
126,563 | 1Q-25 | 5.4% | |||||||||||||||||||||||||||||||||||||||||||||||||||||
| 122-125 N. Vinedo Avenue (SF Valley) | 48,520 | 1Q-25 | 13.5% | |||||||||||||||||||||||||||||||||||||||||||||||||||||
| 29125 Avenue Paine (SF Valley) | 176,107 | 1Q-25 | 6.8% | |||||||||||||||||||||||||||||||||||||||||||||||||||||
218 Turnbull Canyon Road (SG Valley) |
191,153 | 2Q-25 |
9.2% | |||||||||||||||||||||||||||||||||||||||||||||||||||||
1901 Via Burton (North OC) |
139,449 | 2Q-25 |
6.0% | |||||||||||||||||||||||||||||||||||||||||||||||||||||
(1)For definitions of “Properties and Space Under Repositioning/Redevelopment,” “Estimated Construction Period,” “Purchase Price,” “Projected Repositioning/Redevelopment Costs,” “Projected Total Investment,” “Estimated Annual Stabilized Cash NOI,” “Actual Cash NOI,” “Estimated Unlevered Stabilized Yield” and other definitions related to our repositioning/redevelopment/other repositioning portfolio, see pages 36-37 in the Notes and Definitions section of this report.
(2)“Repositioning/Lease-up RSF” is the actual RSF that is subject to repositioning at the property/building, and may be less than the total RSF of the entire property or particular building(s) under repositioning.
(3)As of June 30, 2025, 11308-11350 Penrose Street is considered stabilized as it reached one year from the date of completion of repositioning work but remains in Lease-Up Repositioning as the property has not yet achieved 90% occupancy. Information shown reflects only the 8430 Tujunga Avenue & 11320-11350 Penrose Street building that was repositioned.
(4)During 2Q-25 we leased 1020 Bixby Drive to a single tenant. The leased commenced and the property stabilized on July 1, 2025.
(5)“Other Repositioning” includes 25 projects where estimated costs are generally less than $2.0 million individually. Repositioning at these 25 projects totals 1,140,095 RSF.
(6)Represents the estimated rentable square footage of the project upon completion of redevelopment.
(7)As of June 30, 2025, 3233 Mission Oaks Blvd comprised 409,217 RSF which were not redeveloped. We constructed one new building comprising 116,852 RSF. We also performed site work across the entire project. The total project now contains 526,069 RSF. Costs and yield shown reflect the entire project.
(8)As of June 30, 2025, the property was 0% leased. Subsequent to June 30, 2025, we leased 8888 Balboa Avenue to a single tenant with the lease expected to commence in 3Q-25.
(9)As of June 30, 2025, 3071 Coronado Street is considered stabilized as it reached one year from the date of completion of redevelopment work but remains in Lease-Up Redevelopment as the property has not yet achieved 90% occupancy. As of June 30, 2025, the property was 0% leased. Subsequent to June 30, 2025, we leased the property to a single tenant with the lease expected to commence in 4Q-25.
(10)Rancho Pacifica Building 5 is located at 2370-2398 Pacifica Place and represented one building totaling 51,594 RSF, out of six buildings at our Rancho Pacifica Park property, which had a total of 1,111,885 RSF. We demolished the existing building and constructed a new building comprising 76,553 RSF. The total property now contains 1,175,927 RSF. Amounts detailed in the tables above (RSF, leased %, costs, NOI and stabilized yield) reflect only this one building.
|
Second Quarter 2025
Supplemental Financial Reporting Package
|
Page 31
|
|
||||||
Current Year Investments and Dispositions Summary.
|
||||||||||||||||||||||||||||||||
| As of June 30, 2025 | (unaudited results) | |||||||||||||||||||||||||||||||
2025 Current Period Dispositions | ||||||||||||||||||||||||||||||||
| Disposition Date |
Property Address | County | Submarket | Rentable Square Feet |
Sale Price ($ in MM) |
|||||||||||||||||||||||||||
| 3/28/2025 | 1055 Sandhill Avenue | Los Angeles |
South Bay |
127,775 | $ | 52.45 | ||||||||||||||||||||||||||
| 4/3/2025 | 20 Icon | Orange | South Orange County | 102,299 | $ | 50.88 | ||||||||||||||||||||||||||
| 5/23/2025 | 2270 Camino Vida Roble | San Diego |
North San Diego |
106,311 | $ | 30.70 | ||||||||||||||||||||||||||
| Total 2025 Dispositions through June 30, 2025 | 336,385 | $ | 134.03 | |||||||||||||||||||||||||||||
|
Second Quarter 2025
Supplemental Financial Reporting Package
|
Page 32
|
|
||||||
Net Asset Value Components.
|
||||||||
| As of June 30, 2025 | (unaudited and in thousands, except share data) | |||||||
| Net Operating Income | ||||||||
Pro Forma Net Operating Income (NOI)(1)
|
Three Months Ended Jun 30, 2025 | |||||||
| Total operating rental income | $241,568 | |||||||
| Property operating expenses | (55,298) | |||||||
Pro forma effect of uncommenced leases(2)
|
1,150 | |||||||
Pro forma effect of dispositions(3)
|
(216) | |||||||
Pro forma NOI effect of significant properties classified as current, lease-up, and stabilized repositioning and redevelopment(4)
|
17,386 | |||||||
| Pro Forma NOI | 204,590 | |||||||
Above/(below) market lease revenue adjustments |
(5,788) | |||||||
| Straight line rental revenue adjustment | (6,918) | |||||||
| Pro Forma Cash NOI | $191,884 | |||||||
| Balance Sheet Items | ||||||||
| Other assets and liabilities | June 30, 2025 | |||||||
| Cash and cash equivalents | $431,117 | |||||||
| Restricted cash | 130,071 | |||||||
| Loan receivable, net | 123,474 | |||||||
| Rents and other receivables, net | 12,861 | |||||||
| Other assets | 15,765 | |||||||
| Accounts payable, accrued expenses and other liabilities | (124,814) | |||||||
| Dividends payable | (105,594) | |||||||
| Tenant security deposits | (90,757) | |||||||
| Prepaid rents | (85,494) | |||||||
Estimated remaining cost to complete repositioning/redevelopment projects(5)
|
(152,423) | |||||||
| Total other assets and liabilities | $154,206 | |||||||
| Debt and Shares Outstanding | ||||||||
Total consolidated debt(6)
|
$3,379,141 | |||||||
| Preferred stock/units - liquidation preference | $173,250 | |||||||
Common shares outstanding(7)
|
236,151,829 | |||||||
Operating partnership units outstanding(8)
|
8,182,445 | |||||||
| Total common shares and operating partnership units outstanding | 244,334,274 | |||||||
(1)For definition/discussion of non-GAAP financial measures and reconciliations to their nearest GAAP equivalents, see the definitions & reconciliation section beginning on page 34 and page 12 of this report, respectively.
(2)Represents the estimated incremental base rent from uncommenced new and renewal leases as if they had commenced as of April 1, 2025.
(3)Represents the deduction of actual Q2'25 NOI for the properties that we sold during the current quarter. See page 32 for a detail of current year disposition properties.
(4)Represents the estimated incremental NOI from the properties that were classified as current repositioning/redevelopment, lease-up or stabilized during the three months ended June 30, 2025, assuming that all repositioning/redevelopment work had been completed and all of the properties were fully stabilized as of April 1, 2025. Includes all properties that are separately listed on pages 26-31 and excludes “Other Repositionings” and “Near-Term Potential Future Repositioning and Redevelopment.” We have made a number of assumptions in such estimates & there can be no assurance that we would have generated the projected levels of NOI had these properties actually been stabilized as of April 1, 2025.
(5)Reflects the estimated remaining costs for all properties that are separately listed on pages 26-31 and excludes “Other Repositionings” and “Near-Term Potential Future Repositioning and Redevelopment.”
(6)Excludes unamortized loan discount and debt issuance costs totaling $31.6 million.
(7)Represents outstanding shares of common stock of the Company, which excludes 542,922 shares of unvested restricted stock.
(8)Represents outstanding common units of the Company’s operating partnership, Rexford Industrial Realty, L.P., that are owned by unit holders other than Rexford Industrial Realty, Inc. Includes 1,260,083 vested LTIP Units and 1,262,969 vested performance units and excludes 463,555 unvested LTIP Units and 2,278,110 unvested performance units.
|
Second Quarter 2025
Supplemental Financial Reporting Package
|
Page 33
|
|
||||||
Notes and Definitions.
| ||||||||
Adjusted Funds from Operations (“AFFO”): We calculate adjusted funds from operations, or AFFO, by adding to or subtracting from FFO, as defined below, the following items: (i) certain non-cash operating revenues and expenses, (ii) capitalized operating expenditures such as construction payroll, (iii) recurring capital expenditures required to maintain and re-tenant our properties, (iv) capitalized interest costs resulting from the repositioning/redevelopment of certain of our properties and (v) 2nd generation tenant improvements and leasing commissions. Management uses AFFO as a supplemental performance measure because it provides a performance measure that, when compared year over year, captures trends in portfolio operating results. We also believe that, as a widely recognized measure of the performance of REITs, AFFO will be used by investors as a basis to assess our performance in comparison to other REITs. However, because AFFO may exclude certain non-recurring capital expenditures and leasing costs, the utility of AFFO as a measure of our performance is limited. Additionally, other Equity REITs may not calculate AFFO using the method we do. As a result, our AFFO may not be comparable to such other Equity REITs’ AFFO. AFFO should be considered only as a supplement to net income (as computed in accordance with GAAP) as a measure of our performance.
In-Place Annualized Base Rent and Uncommenced Annualized Base Rent:
•In-Place Annualized Base Rent (“In-Place ABR”): Calculated as the monthly contractual base rent (before rent abatements) per the terms of the lease, as of June 30, 2025, multiplied by 12. Includes leases that had commenced as of June 30, 2025 or leases where tenant had taken early possession of space as of June 30, 2025. Excludes billboard and antenna revenue and tenant reimbursements.
•In-Place ABR per Square Foot: Calculated by dividing In-Place ABR for the lease by the occupied square feet of the lease, as of June 30, 2025.
•Combined In-Place and Uncommenced Annualized Base Rent (“In-Place + Uncommenced ABR”): Calculated by adding (i) In-Place ABR and (ii) ABR Under Uncommenced Leases (see definition below). Does not include adjustments for leases that expired and were not renewed subsequent to June 30, 2025, or adjustments for future known non-renewals.
•ABR Under Uncommenced Leases: Calculated by adding the following:
(i) ABR under Uncommenced New Leases = first full month of contractual base rents (before rent abatements) to be received under Uncommenced New Leases, multiplied by 12.
(ii) Incremental ABR under Uncommenced Renewal Leases = difference between: (a) the first full month of contractual base rents (before rent abatements) to be received under Uncommenced Renewal Leases and (b) the monthly In-Place ABR for the same space as of June 30, 2025, multiplied by 12.
•In-Place + Uncommenced ABR per Square Foot: Calculated by dividing (i) In-Place + Uncommenced ABR for the leases by (ii) the square footage under commenced and uncommenced leases (net of renewal space) as of June 30, 2025.
•Uncommenced New Leases: Reflects new leases (for vacant space) that have been signed but had not yet commenced as of June 30, 2025.
•Uncommenced Renewal Leases: Reflects renewal leases (for space occupied by renewing tenant) that had been signed but had not yet commenced as of June 30, 2025.
Capital Expenditures, Non-recurring: Expenditures made with respect to a property for repositioning, redevelopment, major property or unit upgrade or renovation, and further includes capital expenditures for seismic upgrades, roof or parking lot replacements and capital expenditures for deferred maintenance existing at the time such property was acquired.
Capital Expenditures, Recurring: Expenditures made with respect to a property for maintenance of such property and replacement of items due to ordinary wear and tear including, but not limited to, expenditures made for maintenance of parking lot, roofing materials, mechanical systems, HVAC systems and other structural systems. Recurring capital expenditures shall not include any of the following: (a) major upgrade or renovation of such property not necessary for proper maintenance or marketability of such property; (b) capital expenditures for seismic upgrades; (c) capital expenditures for deferred maintenance for such property existing at the time such property was acquired; or (d) replacements of either roof or parking lots.
Capital Expenditures, First Generation: Capital expenditures for newly acquired space, newly developed or redeveloped space, or change in use.
Cash NOI: Cash basis NOI is a non-GAAP measure, which we calculate by adding or subtracting from NOI (i) amortization of above/(below) market lease intangibles and amortization of other deferred rent resulting from sale leaseback transactions with below market leaseback payments and (ii) straight-line rent adjustment. We use Cash NOI, together with NOI, as a supplemental performance measure. Cash NOI should not be used as a measure of our liquidity, nor is it indicative of funds available to fund our cash needs. Cash NOI should not be used as a substitute for cash flow from operating activities computed in accordance with GAAP. We use Cash NOI to help evaluate the performance of the Company as a whole, as well as the performance of our Same Property Portfolio.
Core Funds from Operations (“Core FFO”): We calculate Core FFO by adjusting FFO for non-comparable items outlined in the “Non-GAAP FFO and Core FFO Reconciliations” on pages 12-13. We believe that Core FFO is a useful supplemental measure and that by adjusting for items that are not considered by us to be part of our ongoing operating performance, provides a more meaningful and consistent comparison of the Company’s operating and financial performance period-over-period. Because these adjustments have a real economic impact on our financial condition and results from operations, the utility of Core FFO as a measure of our performance is limited. Other REITs may not calculate Core FFO in a consistent manner. Accordingly, our Core FFO may not be comparable to other REITs' core FFO. Core FFO should be considered only as a supplement to net income computed in accordance with GAAP as a measure of our performance. “Company Share of Core FFO” reflects Core FFO attributable to common stockholders, which excludes amounts allocable to noncontrolling interests, participating securities and preferred stockholders (which consists of preferred stock dividends, but excludes non-recurring preferred stock redemption charges related to the write-off of original issuance costs which we do not consider reflective of our core revenue or expense streams).
|
Second Quarter 2025
Supplemental Financial Reporting Package
|
Page 34
|
|
||||||
Notes and Definitions.
| ||||||||
Debt Covenants ($ in thousands)
| June 30, 2025 | |||||||||||||||||
| Current Period Covenant | Revolver, $300M & $400M Term Loan Facilities |
Senior Notes ($100M, $125M, $25M, $75M) | |||||||||||||||
| Maximum Leverage Ratio | less than 60% | 21.2% | 27.1% | ||||||||||||||
| Maximum Secured Leverage Ratio | less than 45% | 0.5% | N/A | ||||||||||||||
| Maximum Secured Leverage Ratio | less than 40% | N/A | 0.8% | ||||||||||||||
| Maximum Secured Recourse Debt | less than 15% | N/A | —% | ||||||||||||||
| Minimum Tangible Net Worth | $7,266,909 | N/A | $10,221,199 | ||||||||||||||
| Minimum Fixed Charge Coverage Ratio | at least 1.50 to 1.00 | 5.22 to 1.0 | 5.18 to 1.0 | ||||||||||||||
| Unencumbered Leverage Ratio | less than 60% | 22.2% | 29.4% | ||||||||||||||
| Unencumbered Interest Coverage Ratio | at least 1.75 to 1.00 | 5.70 to 1.00 | 5.70 to 1.00 | ||||||||||||||
| June 30, 2025 | |||||||||||
| Current Period Covenant | Senior Notes ($400M due 2030 & $400M due 2031) |
||||||||||
| Maximum Debt to Total Asset Ratio | less than 60% | 23.9% | |||||||||
| Maximum Secured Debt to Total Asset Ratio | less than 40% | 0.7% | |||||||||
| Minimum Debt Service Coverage Ratio | at least 1.50 to 1.00 | 4.93 to 1.00 | |||||||||
| Minimum Unencumbered Assets to Unsecured Debt Ratio | at least 1.50 to 1.00 | 4.23 to 1.00 | |||||||||
EBITDAre and Adjusted EBITDAre: We calculate EBITDAre in accordance with the standards established by the National Association of Real Estate Investment Trusts (“NAREIT”). EBITDAre is calculated as net income (loss) (computed in accordance with GAAP), before interest expense, tax expense, depreciation and amortization, gains (or losses) from sales of depreciable operating property, impairment losses of depreciable property and adjustments to reflect our proportionate share of EBITDAre from our unconsolidated joint venture. We calculate Adjusted EBITDAre by adding or subtracting from EBITDAre the following items: (i) non-cash stock based compensation expense, (ii) gain (loss) on debt extinguishment and debt modification expenses, (iii) acquisition expenses, (iv) impairments of right of use assets and (v) the pro-forma effects of acquisitions and dispositions. We believe that EBITDAre and Adjusted EBITDAre are helpful to investors as a supplemental measure of our operating performance as a real estate company because it is a direct measure of the actual operating results of our industrial properties. We also use these measures in ratios to compare our performance to that of our industry peers. In addition, we believe EBITDAre and Adjusted EBITDAre are frequently used by securities analysts, investors and other interested parties in the evaluation of Equity REITs. However, because EBITDAre and Adjusted EBITDAre are calculated before recurring cash charges including interest expense and income taxes, and are not adjusted for capital expenditures or other recurring cash requirements of our business, their utility as a measure of our liquidity is limited. Accordingly, EBITDAre and Adjusted EBITDAre should not be considered alternatives to cash flow from operating activities (as computed in accordance with GAAP) as a measure of our liquidity. EBITDAre and Adjusted EBITDAre should not be considered as alternatives
to net income or loss as an indicator of our operating performance. Other Equity REITs may calculate EBITDAre and Adjusted EBITDAre differently than we do; accordingly, our EBITDAre and Adjusted EBITDAre may not be comparable to such other Equity REITs’ EBITDAre and Adjusted EBITDAre. EBITDAre and Adjusted EBITDAre should be considered only as supplements to net income (as computed in accordance with GAAP) as a measure of our performance.
Ending occupancy excluding repositioning/redevelopment: Represents consolidated portfolio occupancy adjusted to exclude all vacant SF associated with Repositioning and Redevelopment projects, including those combined in “Other Repositioning”.
Fixed Charge Coverage Ratio:
For the Three Months Ended |
|||||||||||||||||||||||||||||
| Jun 30, 2025 | Mar 31, 2025 | Dec 31, 2024 | Sep 30, 2024 | Jun 30, 2024 | |||||||||||||||||||||||||
EBITDAre
|
$ | 173,922 | $ | 174,919 | $ | 164,915 | $ | 165,558 | $ | 166,057 | |||||||||||||||||||
Above/(below) market lease revenue adjustments |
(5,788) | (9,186) | (6,159) | (6,635) | (7,268) | ||||||||||||||||||||||||
Non-cash stock compensation |
10,091 | 9,699 | 11,539 | 9,918 | 11,057 | ||||||||||||||||||||||||
Debt extinguishment and modification expenses |
291 | — | — | — | — | ||||||||||||||||||||||||
Straight line rental revenue adj. |
(6,918) | (5,517) | (10,057) | (11,441) | (9,567) | ||||||||||||||||||||||||
Capitalized payments |
(5,304) | (5,091) | (4,592) | (5,323) | (4,930) | ||||||||||||||||||||||||
| Accretion of net loan origination fees | (115) | (115) | (115) | (115) | (115) | ||||||||||||||||||||||||
Recurring capital expenditures |
(5,887) | (1,311) | (7,882) | (5,254) | (3,502) | ||||||||||||||||||||||||
| 2nd gen. tenant improvements | (663) | (162) | (296) | (18) | (123) | ||||||||||||||||||||||||
| 2nd gen. leasing commissions | (4,162) | (4,879) | (3,520) | (2,660) | (7,436) | ||||||||||||||||||||||||
| Cash flow for fixed charge coverage calculation | $ | 155,467 | $ | 158,357 | $ | 143,833 | $ | 144,030 | $ | 144,173 | |||||||||||||||||||
| Cash interest expense calculation detail: | |||||||||||||||||||||||||||||
| Interest expense | 26,701 | 27,288 | 28,173 | 27,340 | 28,412 | ||||||||||||||||||||||||
| Capitalized interest | 9,064 | 8,230 | 7,510 | 8,577 | 7,350 | ||||||||||||||||||||||||
| Note payable premium amort. | (1,579) | (1,560) | (1,534) | (1,511) | (1,491) | ||||||||||||||||||||||||
| Amort. of deferred financing costs | (1,255) | (1,134) | (1,246) | (1,252) | (1,266) | ||||||||||||||||||||||||
| Amort. of swap term fees & t-locks | (76) | (77) | (112) | (136) | (137) | ||||||||||||||||||||||||
| Cash interest expense | 32,855 | 32,747 | 32,791 | 33,018 | 32,868 | ||||||||||||||||||||||||
| Scheduled principal payments | 242 | 230 | 254 | 286 | 298 | ||||||||||||||||||||||||
| Preferred stock/unit dividends | 2,405 | 2,695 | 2,827 | 2,815 | 2,846 | ||||||||||||||||||||||||
| Fixed charges | $ | 35,502 | $ | 35,672 | $ | 35,872 | $ | 36,119 | $ | 36,012 | |||||||||||||||||||
| Fixed Charge Coverage Ratio | 4.4 | x | 4.4 | x | 4.0 | x | 4.0 | x | 4.0 | x | |||||||||||||||||||
|
Second Quarter 2025
Supplemental Financial Reporting Package
|
Page 35
|
|
||||||
Notes and Definitions.
| ||||||||
NAREIT Defined Funds from Operations (“FFO”): We calculate FFO in accordance with the standards established by NAREIT. FFO represents net income (loss) (computed in accordance with GAAP), excluding gains (or losses) on sale of real estate assets, gains (or losses) on sale of assets incidental to our business, impairment losses of depreciable operating property or assets incidental to our business, real estate related depreciation and amortization (excluding amortization of deferred financing costs) and after adjustments for unconsolidated joint ventures. Management uses FFO as a supplemental performance measure because, in excluding real estate related depreciation and amortization, gains and losses from property dispositions or assets incidental to our business, other than temporary impairments of unconsolidated real estate entities, and impairment on our investment in real estate and other assets incidental to our business, it provides a performance measure that, when compared year over year, captures trends in occupancy rates, rental rates and operating costs. We also believe that, as a widely recognized measure of performance used by other REITs, FFO may be used by investors as a basis to compare our operating performance with that of other REITs. However, because FFO excludes depreciation and amortization and captures neither the changes in the value of our properties that result from use or market conditions nor the level of capital expenditures and leasing commissions necessary to maintain the operating performance of our properties, all of which have real economic effects and could materially impact our results from operations, the utility of FFO as a measure of our performance is limited. Other equity REITs may not calculate or interpret FFO in accordance with the NAREIT definition as we do, and, accordingly, our FFO may not be comparable to such other REITs’ FFO. FFO should not be used as a measure of our liquidity, and is not indicative of funds available for our cash needs, including our ability to pay dividends. FFO should be considered only as a supplement to net income computed in accordance with GAAP as a measure of our performance. “Company Share of FFO” reflects FFO attributable to common stockholders, which excludes amounts allocable to noncontrolling interests, participating securities and preferred stockholders (which consists of preferred stock dividends and any preferred stock redemption charges related to the write-off of original issuance costs).
Net Operating Income (“NOI”): NOI is a non-GAAP measure which includes the revenue and expense directly attributable to our real estate properties. NOI is calculated as total revenue from real estate operations including i) rental revenue, ii) tenant reimbursements, and iii) other income less property expenses. We use NOI as a supplemental performance measure because, in excluding real estate depreciation and amortization expense, general and administrative expenses, interest expense, interest income, gains (or losses) on sale of real estate and other non-operating items, it provides a performance measure that, when compared year over year, captures trends in occupancy rates, rental rates and operating costs. We also believe that NOI will be useful to investors as a basis to compare our operating performance with that of other REITs. However, because NOI excludes depreciation and amortization expense and captures neither the changes in the value of our properties that result from use or market conditions, nor the level of capital expenditures and leasing commissions necessary to maintain the operating performance of our properties (all of which have real economic effect and could materially impact our results from operations), the utility of NOI as a measure of our performance is limited. Other equity REITs may not calculate NOI in a similar manner and, accordingly, our NOI may not be comparable to such other REITs’ NOI. Accordingly, NOI should be considered only as a supplement to net income as a measure of our performance. NOI should not be used as a measure of our liquidity, nor is it indicative of funds available to fund our cash needs. NOI should not be used as a substitute for cash flow from operating activities in accordance with GAAP. We use NOI to help evaluate the performance of the Company as a whole, as well as the performance of our Same Property Portfolio.
Proforma NOI: Proforma NOI is calculated by adding to NOI the following adjustments: (i) the estimated impact on NOI of uncommenced leases as if they had commenced at the beginning of the reportable period, (ii) the estimated impact on NOI of current period acquisitions as if they had been acquired at the beginning of the reportable period, (iii) the actual NOI of properties sold during the current period and (iv) the estimated incremental NOI from properties that were classified as repositioning/lease-up properties as of the end of the reporting period, assuming that all repositioning work had been completed and the properties/space were fully stabilized as of the beginning of the reportable period. These estimates do not purport to be indicative of what operating results would have been had the transactions actually occurred at the beginning of the reportable period and may not be indicative of future operating results.
Definitions Related to Properties and Space Under Repositioning/Redevelopment:
•Properties and Space Under Repositioning: Typically defined as properties or units where a significant amount of space is held vacant in order to implement capital improvements that improve the functionality (not including basic refurbishments, i.e., paint and carpet), cash flow and value of that space. A repositioning is generally considered complete once the investment is fully or nearly fully deployed and the property is available for occupancy.
•Properties Under Redevelopment: Typically defined as properties where we plan to fully or partially demolish an existing building(s) due to building obsolescence and/or a property with excess or vacant land where we plan to construct a ground-up building.
•Estimated Construction Period: The “Start” of the Estimated Construction Period is our current estimate of the period in which we will start physical construction on a property. The Target Completion of the Estimated Construction Period is our current estimate of the period in which we will have substantially completed a project and the project is made available for occupancy. We expect to update our timing estimates on a quarterly basis. For projects stabilized or in lease-up, represents the actual construction completion period.
•Purchase Price: Represents the contractual purchase price of the property plus closing costs.
•Projected Repositioning/Redevelopment Costs: Represents the estimated costs to be incurred to complete construction and lease-up each repositioning/redevelopment project. Estimated costs include (i) nonrecurring capital expenditures, (ii) estimated tenant improvement allowances/costs and (iii) estimated leasing commissions. We expect to update our estimates upon completion of the project, or sooner if there are any significant changes to expected costs from quarter to quarter. Excludes capitalized costs including capitalized interest, property taxes, insurance and compensation.
•Projected Total Investment: Includes the sum of the Purchase Price and Projected Repositioning/Redevelopment Costs.
•Cumulative Investment to Date: Includes the Purchase Price and nonrecurring capital expenditures, tenant improvement costs and leasing commission costs incurred as of the reporting date.
•Estimated Annual Stabilized Cash NOI: Represents management’s estimate of each project’s annual Cash NOI once the property has reached stabilization and initial rental concessions, if any, have elapsed. Actual results may vary materially from our estimates.
|
Second Quarter 2025
Supplemental Financial Reporting Package
|
Page 36
|
|
||||||
Notes and Definitions.
| ||||||||
•Actual Cash NOI: Represents the actual cash NOI (a non-GAAP measure defined on page 34) for the repositioning/redevelopment property for the entire reported quarter or from the date of acquisition if such property was acquired during the current reported quarter.
•Estimated Unlevered Stabilized Yield: Calculated by dividing each project’s Estimated Annual Stabilized Cash NOI by its Projected Total Investment.
•Stabilization Date - Properties and Space Under Repositioning/Redevelopment: We consider a repositioning/redevelopment property to be stabilized at the earlier of the following: (i) upon reaching 90% occupancy or (ii) one year from the date of completion of repositioning/redevelopment construction work.
Rental Income: See below for a breakdown of consolidated rental income for the last five trailing quarters. We believe this information is frequently used by management, investors, securities analysts and other interested parties to evaluate our performance.
| Three Months Ended | |||||||||||||||||||||||||||||
| Jun 30, 2025 | Mar 31, 2025 | Dec 31, 2024 | Sep 30, 2024 | Jun 30, 2024 | |||||||||||||||||||||||||
| Rental revenue (before collectability adjustment) | $ | 199,839 | $ | 208,394 | $ | 199,601 | $ | 197,506 | $ | 193,497 | |||||||||||||||||||
| Tenant reimbursements | 41,403 | 41,856 | 39,716 | 40,969 | 39,682 | ||||||||||||||||||||||||
| Other income | 467 | 874 | 620 | 651 | 598 | ||||||||||||||||||||||||
| Increase (reduction) in revenue due to change in collectability assessment | (141) | (2,303) | (200) | (730) | (804) | ||||||||||||||||||||||||
| Rental income | $ | 241,568 | $ | 248,821 | $ | 239,737 | $ | 238,396 | $ | 232,973 | |||||||||||||||||||
Cash Rent Change: Compares the first month cash rent excluding any abatement on new/renewal leases to the last month rent for the most recent expiring lease. Data included for comparable leases only. Comparable leases generally exclude: (i) space that has never been occupied under our ownership, (ii) repositioned/redeveloped space, including space in pre-development/entitlement process, (iii) space that has been vacant for over one year or (iv) lease terms shorter than twelve months.
Net Effective Rent Change: Compares net effective rent, which straightlines rental rate increases and abatements, on new/renewal leases to net effective rent for the most recent expiring lease. Data included for comparable leases only. Comparable leases generally exclude: (i) space that has never been occupied under our ownership, (ii) repositioned/redeveloped space, including space in pre-development/entitlement process, (iii) space that has been vacant for over one year or (iv) lease terms shorter than twelve months.
Same Property Portfolio (“SPP”): Our 2025 SPP is a subset of our consolidated portfolio and includes properties that were wholly owned by us for the period from January 1, 2024 through June 30, 2025, and excludes (i) properties that were acquired or sold during the period from January 1, 2024 through June 30, 2025, and (ii) properties acquired prior to January 1, 2024 that were or will be classified as repositioning/redevelopment (current and future) or lease-up during 2024 and 2025 (as separately listed on pages 26-31) and select buildings in “Other Repositioning,” which we believe will significantly affect the properties’ results during the comparative periods.
SPP Historical Information: The table below reflects selected information related to our SPP as initially reported in each quarter’s respective supplemental package. Within a given year, the SPP may reflect changes in repositioning/redevelopment properties or removal of sold properties.
| Three Months Ended | |||||||||||||||||||||||||||||
| Jun 30, 2025 | Mar 31, 2025 | Dec 31, 2024 | Sep 30, 2024 | Jun 30, 2024 | |||||||||||||||||||||||||
| # of Properties | 289 | 292 | 293 | 293 | 293 | ||||||||||||||||||||||||
| Square Feet | 37,991,248 | 38,380,256 | 36,961,884 | 36,961,821 | 36,956,243 | ||||||||||||||||||||||||
| Ending Occupancy | 96.1 | % | 95.7 | % | 94.1 | % | 96.7 | % | 97.3 | % | |||||||||||||||||||
| SPP NOI growth | 1.1 | % | 0.7 | % | 2.2 | % | 2.6 | % | 6.0 | % | |||||||||||||||||||
| SPP Cash NOI growth | 3.9 | % | 5.0 | % | 5.3 | % | 5.3 | % | 9.1 | % | |||||||||||||||||||
Same Property Portfolio Rental Income: See below for a breakdown of 2025 & 2024 rental income for our SPP. We believe this information is frequently used by management, investors, securities analysts and other interested parties to evaluate our performance.
| Three Months Ended June 30, | Six Months Ended June 30, | ||||||||||||||||||||||||||||||||||||||||||||||
| 2025 | 2024 | $ Change | % Change | 2025 | 2024 | $ Change | % Change | ||||||||||||||||||||||||||||||||||||||||
| Rental revenue | $ | 159,572 | $ | 156,668 | $ | 2,904 | 1.9% | $ | 315,335 | $ | 310,893 | $ | 4,442 | 1.4% | |||||||||||||||||||||||||||||||||
| Tenant reimbursements | 31,678 | 31,009 | 669 | 2.2% | 63,525 | 62,284 | 1,241 | 2.0% | |||||||||||||||||||||||||||||||||||||||
| Other income | 403 | 506 | (103) | (20.4)% | 1,152 | 1,193 | (41) | (3.4)% | |||||||||||||||||||||||||||||||||||||||
| Rental income | $ | 191,653 | $ | 188,183 | $ | 3,470 | 1.8% | $ | 380,012 | $ | 374,370 | $ | 5,642 | 1.5% | |||||||||||||||||||||||||||||||||
Reconciliation of Net Income to NOI and Cash NOI (in thousands):
| Three Months Ended | |||||||||||||||||||||||||||||
| Jun 30, 2025 | Mar 31, 2025 | Dec 31, 2024 | Sep 30, 2024 | Jun 30, 2024 | |||||||||||||||||||||||||
| Net Income | $ | 120,394 | $ | 74,048 | $ | 64,910 | $ | 70,722 | $ | 86,017 | |||||||||||||||||||
| General and administrative | 19,752 | 19,868 | 21,940 | 20,926 | 19,307 | ||||||||||||||||||||||||
| Depreciation & amortization | 71,188 | 86,740 | 71,832 | 69,241 | 67,896 | ||||||||||||||||||||||||
| Other expenses | 244 | 2,239 | 34 | 492 | 304 | ||||||||||||||||||||||||
| Interest expense | 26,701 | 27,288 | 28,173 | 27,340 | 28,412 | ||||||||||||||||||||||||
Debt extinguishment and modification expenses |
291 | — | — | — | — | ||||||||||||||||||||||||
| Management & leasing services | (132) | (142) | (167) | (156) | (156) | ||||||||||||||||||||||||
| Interest income | (7,807) | (3,324) | (2,991) | (3,291) | (4,444) | ||||||||||||||||||||||||
| Gains on sale of real estate | (44,361) | (13,157) | — | (1,745) | (16,268) | ||||||||||||||||||||||||
| NOI | $ | 186,270 | $ | 193,560 | $ | 183,731 | $ | 183,529 | $ | 181,068 | |||||||||||||||||||
| S/L rental revenue adj. | (6,918) | (5,517) | (10,057) | (11,441) | (9,567) | ||||||||||||||||||||||||
Above/(below) market lease revenue adjustments |
(5,788) | (9,186) | (6,159) | (6,635) | (7,268) | ||||||||||||||||||||||||
| Cash NOI | $ | 173,564 | $ | 178,857 | $ | 167,515 | $ | 165,453 | $ | 164,233 | |||||||||||||||||||
|
Second Quarter 2025
Supplemental Financial Reporting Package
|
Page 37
|
|
||||||
Notes and Definitions.
| ||||||||
Reconciliation of Net Income to Total Portfolio NOI, Same Property Portfolio NOI and Same Property Portfolio Cash NOI:
| Three Months Ended June 30, | Six Months Ended June 30, | ||||||||||||||||||||||
| 2025 | 2024 | 2025 | 2024 | ||||||||||||||||||||
| Net income | $ | 120,394 | $ | 86,017 | $ | 194,442 | $ | 150,294 | |||||||||||||||
| General and administrative | 19,752 | 19,307 | 39,620 | 39,287 | |||||||||||||||||||
| Depreciation and amortization | 71,188 | 67,896 | 157,928 | 134,174 | |||||||||||||||||||
| Other expenses | 244 | 304 | 2,483 | 1,712 | |||||||||||||||||||
| Interest expense | 26,701 | 28,412 | 53,989 | 43,083 | |||||||||||||||||||
Debt extinguishment and modification expenses |
291 | — | 291 | — | |||||||||||||||||||
| Management and leasing services | (132) | (156) | (274) | (288) | |||||||||||||||||||
| Interest income | (7,807) | (4,444) | (11,131) | (7,418) | |||||||||||||||||||
| Gains on sale of real estate | (44,361) | (16,268) | (57,518) | (16,268) | |||||||||||||||||||
| NOI | $ | 186,270 | $ | 181,068 | $ | 379,830 | $ | 344,576 | |||||||||||||||
| Non-Same Property Portfolio rental income | (49,915) | (44,790) | (110,377) | (69,593) | |||||||||||||||||||
| Non-Same Property Portfolio property exp. | 13,238 | 11,663 | 27,025 | 18,887 | |||||||||||||||||||
| Same Property Portfolio NOI | $ | 149,593 | $ | 147,941 | $ | 296,478 | $ | 293,870 | |||||||||||||||
| Straight line rental revenue adjustment | (4,804) | (7,503) | (7,959) | (14,758) | |||||||||||||||||||
Above/(below) market lease revenue adjustments |
(5,129) | (6,034) | (10,001) | (12,471) | |||||||||||||||||||
| Same Property Portfolio Cash NOI | $ | 139,660 | $ | 134,404 | $ | 278,518 | $ | 266,641 | |||||||||||||||
Reconciliation of Net Income Attributable to Common Stockholders per Diluted Share Guidance to Company share of Core FFO per Diluted Share Guidance:
| 2025 Estimate | |||||||||||
| Low | High | ||||||||||
| Net income attributable to common stockholders | $ | 1.38 | $ | 1.42 | |||||||
| Company share of depreciation and amortization | 1.23 | 1.23 | |||||||||
Company share of gains on sale of real estate(1)
|
(0.25) | (0.25) | |||||||||
| Company share of FFO | $ | 2.36 | $ | 2.40 | |||||||
Add: Core FFO adjustments(2)
|
0.01 | 0.01 | |||||||||
| Company share of Core FFO | $ | 2.37 | $ | 2.41 | |||||||
(1)Reflects dispositions through June 30, 2025. See details on page 32
(2)Core FFO adjustments consist of (i) acquisition expenses, (ii) debt extinguishment and modification expenses, (iii) the amortization of the loss on termination of interest rate swaps and (iv) severance costs associated with workforce reduction.
Occupancy by County:
| Jun 30, 2025 | Mar 31, 2025 | Dec 31, 2024 | Sep 30, 2024 | Jun 30, 2024 | ||||||||||||||||||||||||||||
| Ending Occupancy: | ||||||||||||||||||||||||||||||||
| Los Angeles County | 87.9% | 88.0% | 90.2% | 93.6% | 94.9% | |||||||||||||||||||||||||||
| Orange County | 90.7% | 88.4% | 90.3% | 90.6% | 88.0% | |||||||||||||||||||||||||||
| Riverside / San Bernardino County | 93.9% | 95.9% | 96.0% | 93.9% | 94.8% | |||||||||||||||||||||||||||
| San Diego County | 86.7% | 89.6% | 89.8% | 92.3% | 92.6% | |||||||||||||||||||||||||||
| Ventura County | 87.5% | 87.7% | 91.2% | 89.8% | 92.5% | |||||||||||||||||||||||||||
| Total/Weighted Average | 89.2% | 89.6% | 91.3% | 93.0% | 93.7% | |||||||||||||||||||||||||||
| Total Portfolio RSF | 51,021,897 | 50,952,137 | 50,788,225 | 50,067,981 | 49,710,628 | |||||||||||||||||||||||||||
Uncommenced Lease Data:
| Total/Weighted Average | ||||||||
| Occupied SF | 45,518,192 | |||||||
Uncommenced Renewal Leases - Leased SF(1)
|
1,319,891 | |||||||
Uncommenced New Leases - Leased SF(1)
|
296,280 | |||||||
| Leased SF | 45,814,472 | |||||||
| Percent Leased | 89.8 | % | ||||||
In-Place ABR(2)
|
$ | 778,829 | ||||||
ABR Under Uncommenced Leases (in thousands)(2)(3)
|
5,508 | |||||||
In-Place + Uncommenced ABR (in thousands)(2)
|
$ | 784,337 | ||||||
In-Place + Uncommenced ABR per SF(2)
|
$ | 17.12 | ||||||
(1)Reflects the square footage of renewal and new leases, respectively, that have been signed but have not yet commenced as of June 30, 2025.
(2)See page 34 for further details on how these amounts are calculated.
(3)Includes $4.5 million of annualized base rent under Uncommenced New Leases and $1.0 million of incremental annualized base rent under Uncommenced Renewal Leases.
|
Second Quarter 2025
Supplemental Financial Reporting Package
|
Page 38
|
|
||||||