EXHIBIT 99.2
Published on February 12, 2019
Exhibit 99.2
Table of Contents.
|
||
Section |
Page |
Corporate Data: |
|
Investor Company Summary |
3 |
Financial and Portfolio Highlights and Common Stock Data |
4 |
Consolidated Financial Results: |
|
Consolidated Balance Sheets |
5 |
Consolidated Statements of Operations |
6-7 |
Non-GAAP FFO, Core FFO and AFFO Reconciliations |
8-9 |
Statement of Operations Reconciliations |
10 |
Same Property Portfolio Performance |
11 |
Capitalization Summary |
12 |
Debt Summary |
13 |
Portfolio Data: |
|
Portfolio Overview |
14 |
Occupancy and Leasing Trends |
15 |
Leasing Statistics |
16-17 |
Top Tenants and Lease Segmentation |
18 |
Capital Expenditure Summary |
19 |
Properties and Space Under Repositioning |
20-21 |
Current Year Acquisitions and Dispositions Summary |
22 |
Guidance |
23 |
Net Asset Value Components |
24 |
Notes and Definitions |
25-28 |
Disclosures:
Forward Looking Statements: This supplemental package contains “forward-looking statements” within the meaning of the Private Securities Litigation Reform Act of 1995. We caution investors that any forward-looking statements presented herein are based on management’s beliefs and assumptions and information currently available to management. Such statements are subject to risks, uncertainties and assumptions and may be affected by known and unknown risks, trends, uncertainties and factors that are beyond our control. Should one or more of these risks or uncertainties materialize, or should underlying assumptions prove incorrect, actual results may vary materially from those anticipated, estimated or projected. These risks and uncertainties include, without limitation: general risks affecting the real estate industry (including, without limitation, the market value of our properties, the inability to enter into or renew leases at favorable rates, dependence on tenants’ financial condition, and competition from other developers, owners and operators of real estate); risks associated with the disruption of credit markets or a global economic slowdown; risks associated with the potential loss of key personnel (most importantly, members of senior management); risks associated with our failure to maintain our status as a Real Estate Investment Trust under the Internal Revenue Code of 1986, as amended; possible adverse changes in tax and environmental laws; litigation, including costs associated with prosecuting or defending pending or threatened claims and any adverse outcomes, and potential liability for uninsured losses and environmental contamination.
For a further discussion of these and other factors that could cause our future results to differ materially from any forward-looking statements, see Item 1A. Risk Factors in our 2017 Annual Report on Form 10-K, which was filed with the Securities and Exchange Commission (“SEC”) on February 21, 2018. We disclaim any obligation to publicly update or revise any forward-looking statement to reflect changes in underlying assumptions or factors, of new information, data or methods, future events or other changes.
|
Fourth Quarter 2018
Supplemental Financial Reporting Package
|
Page 2
|

|
|
Investor Company Summary.
|
||
Executive Management Team | ||
Howard Schwimmer |
Co-Chief Executive Officer, Director |
|
Michael S. Frankel |
Co-Chief Executive Officer, Director |
|
Adeel Khan |
Chief Financial Officer |
|
David Lanzer |
General Counsel and Corporate Secretary |
|
Board of Directors | ||
Richard Ziman |
Chairman |
|
Howard Schwimmer |
Co-Chief Executive Officer, Director |
|
Michael S. Frankel |
Co-Chief Executive Officer, Director |
|
Robert L. Antin |
Director |
|
Steven C. Good |
Director |
|
Diana J. Ingram |
Director |
|
Tyler H. Rose |
Director |
|
Peter Schwab |
Director |
|
Investor Relations Information | ||
ICR | ||
Stephen Swett | ||
www.icrinc.com | ||
212-849-3882 | ||
Equity Research Coverage |
||||
Bank of America Merrill Lynch |
James Feldman |
(646) 855-5808 |
||
Capital One |
Chris Lucas |
(571) 633-8151 |
||
Citigroup Investment Research |
Emmanuel Korchman |
(212) 816-1382 |
||
D.A Davidson |
Barry Oxford |
(212) 240-9871 |
||
J.P. Morgan |
Michael W. Mueller, CFA |
(212) 622-6689 |
||
Jefferies LLC |
Jonathan Petersen |
(212) 284-1705 |
||
National Securities Corporation |
Chris Testa |
(212) 417-8127 |
||
Stifel Nicolaus & Co. |
John W. Guinee |
(443) 224-1307 |
||
Wells Fargo Securities |
Blaine Heck |
(443) 263-6529 |
||
Disclaimer: This list may not be complete and is subject to change as firms add or delete coverage of our company. Please note that any opinions, estimates, forecasts or predictions regarding our historical or predicted performance made by these analysts are theirs alone and do not represent opinions, estimates, forecasts or predictions of Rexford Industrial Realty, Inc. or its management. We are providing this listing as a service to our stockholders and do not by listing these firms imply our endorsement of, or concurrence with, such information, conclusions or recommendations. Interested persons may obtain copies of analysts’ reports on their own; we do not distribute these reports.
|
Fourth Quarter 2018
Supplemental Financial Reporting Package
|
Page 3
|
|
|
Financial and Portfolio Highlights and Common Stock Data. (1)
|
||
(in thousands except share and per share data and portfolio statistics) |
||
Three Months Ended |
|||||||||||||||||||
December 31, 2018 |
September 30, 2018 |
June 30, 2018 |
March 31, 2018 |
December 31, 2017 |
|||||||||||||||
Financial Results: |
|||||||||||||||||||
Total rental revenues |
$ |
56,125 |
$ |
54,469 |
$ |
51,616 |
$ |
48,433 |
$ |
45,767 |
|||||||||
Net income |
$ |
15,207 |
$ |
8,965 |
$ |
7,819 |
$ |
15,084 |
$ |
14,115 |
|||||||||
Net Operating Income (NOI) |
$ |
42,483 |
$ |
41,175 |
$ |
38,841 |
$ |
36,473 |
$ |
33,615 |
|||||||||
Company share of Core FFO |
$ |
27,216 |
$ |
26,050 |
$ |
22,882 |
$ |
21,424 |
$ |
20,025 |
|||||||||
Company share of Core FFO per common share - diluted |
$ |
0.29 |
$ |
0.28 |
$ |
0.27 |
$ |
0.27 |
$ |
0.26 |
|||||||||
Adjusted EBITDA |
$ |
40,348 |
$ |
38,003 |
$ |
36,784 |
$ |
32,306 |
$ |
30,675 |
|||||||||
Dividend declared per common share |
$ |
0.160 |
$ |
0.160 |
$ |
0.160 |
$ |
0.160 |
$ |
0.145 |
|||||||||
Portfolio Statistics: |
|||||||||||||||||||
Portfolio SF - consolidated |
21,295,443 |
20,505,157 |
20,213,729 |
18,741,304 |
18,476,809 |
||||||||||||||
Ending occupancy - consolidated portfolio |
95.4 |
% |
95.1 |
% |
95.2 |
% |
95.2 |
% |
95.5 |
% |
|||||||||
Stabilized occupancy - consolidated portfolio |
97.5 |
% |
97.6 |
% |
98.1 |
% |
97.7 |
% |
98.2 |
% |
|||||||||
Leasing spreads - GAAP |
25.1 |
% |
32.2 |
% |
35.5 |
% |
25.3 |
% |
27.7 |
% |
|||||||||
Leasing spreads - cash |
14.8 |
% |
21.1 |
% |
23.9 |
% |
14.9 |
% |
18.9 |
% |
|||||||||
Same Property Performance: |
|||||||||||||||||||
Same Property Portfolio SF |
14,106,629 |
14,106,629 |
14,040,668 |
14,040,668 |
14,040,668 |
||||||||||||||
Same Property Portfolio ending occupancy |
96.7 |
% |
97.1 |
% |
96.1 |
% |
95.1 |
% |
95.3 |
% |
|||||||||
Same Property Portfolio NOI growth(2)
|
9.6 |
% |
12.6 |
% |
10.5 |
% |
9.3 |
% |
n/a |
||||||||||
Same Property Portfolio Cash NOI growth(2)
|
12.4 |
% |
14.8 |
% |
9.9 |
% |
8.3 |
% |
n/a |
||||||||||
Stabilized Same Property Portfolio ending occupancy |
98.2 |
% |
98.7 |
% |
98.6 |
% |
97.7 |
% |
98.1 |
% |
|||||||||
Stabilized Same Property Portfolio NOI growth(2)
|
5.1 |
% |
8.7 |
% |
7.7 |
% |
7.4 |
% |
n/a |
||||||||||
Stabilized Same Property Portfolio Cash NOI growth(2)
|
7.8 |
% |
11.6 |
% |
9.6 |
% |
8.0 |
% |
n/a |
||||||||||
Capitalization: |
|||||||||||||||||||
Common stock price at quarter end |
$ |
29.47 |
$ |
31.96 |
$ |
31.39 |
$ |
28.79 |
$ |
29.16 |
|||||||||
Common shares issued and outstanding |
96,610,106 |
92,497,666 |
90,848,198 |
80,441,338 |
78,305,187 |
||||||||||||||
Total shares and units issued and outstanding at period end (3)
|
99,025,917 |
94,500,770 |
92,861,762 |
82,482,513 |
80,323,432 |
||||||||||||||
Weighted average shares outstanding - diluted |
94,487,773 |
91,945,206 |
83,494,825 |
79,196,060 |
78,227,824 |
||||||||||||||
5.875% Series A and Series B Cumulative Redeemable Preferred Stock |
$ |
165,000 |
$ |
165,000 |
$ |
165,000 |
$ |
165,000 |
$ |
165,000 |
|||||||||
Total equity market capitalization |
$ |
3,083,294 |
$ |
3,185,245 |
$ |
3,079,931 |
$ |
2,539,672 |
$ |
2,507,231 |
|||||||||
Total consolidated debt |
$ |
761,116 |
$ |
761,154 |
$ |
761,192 |
$ |
662,425 |
$ |
671,657 |
|||||||||
Total combined market capitalization (net debt plus equity) |
$ |
3,663,809 |
$ |
3,762,495 |
$ |
3,678,419 |
$ |
3,186,472 |
$ |
3,172,268 |
|||||||||
Ratios: |
|||||||||||||||||||
Net debt to total combined market capitalization |
15.8 |
% |
15.3 |
% |
16.3 |
% |
20.3 |
% |
21.0 |
% |
|||||||||
Net debt to Adjusted EBITDA (quarterly results annualized) |
3.6x |
3.8x |
4.1x |
5.0x |
5.4x |
||||||||||||||
(1) |
For definition/discussion of non-GAAP financial measures and reconciliations to their nearest GAAP equivalents, see the definitions section and reconciliation section beginning on page 25 and page 8 of this report, respectively.
|
(2) |
Represents the year over year percentage change in NOI and Cash NOI for the Same Property Portfolio and Stabilized Same Property Portfolio. For comparability, NOI growth and Cash NOI growth for Q1’18, Q2’18 and Q3’18 has been restated to remove the results of 311 East 157th Street, 329 East 157th Street and 319 East 157th Street which were sold during Q4’18. See page 22 for a list of dispositions completed during 2018. |
(3) |
Includes the following number of OP Units and vested LTIP units held by noncontrolling interests: 2,415,811 (Dec 31, 2018), 2,003,104 (Sep 30, 2018), 2,013,564 (Jun 30, 2018), 2,041,175 (Mar 31, 2018) and 2,018,245 (Dec 31, 2017). Excludes the following number of shares of unvested restricted stock: 200,398 (Dec 31, 2018), 209,214 (Sep 30, 2018), 213,867 (Jun 30, 2018), 226,451 (Mar 31, 2018) and 190,695 (Dec 31, 2017). Excludes unvested LTIP units and unvested performance units.
|
|
Fourth Quarter 2018
Supplemental Financial Reporting Package
|
Page 4
|
|
|
Consolidated Balance Sheets.
|
||
(unaudited and in thousands) |
||
December 31, 2018 |
September 30, 2018 |
June 30, 2018 |
March 31, 2018 |
December 31, 2017 |
|||||||||||||||
ASSETS |
|||||||||||||||||||
Land |
$ |
1,298,957 |
$ |
1,218,386 |
$ |
1,199,633 |
$ |
1,020,652 |
$ |
997,588 |
|||||||||
Buildings and improvements |
1,332,438 |
1,253,935 |
1,229,100 |
1,098,695 |
1,079,746 |
||||||||||||||
Tenant improvements |
60,024 |
54,808 |
53,531 |
50,998 |
49,692 |
||||||||||||||
Furniture, fixtures, and equipment |
149 |
151 |
151 |
151 |
167 |
||||||||||||||
Construction in progress |
24,515 |
50,367 |
44,631 |
45,688 |
34,772 |
||||||||||||||
Total real estate held for investment |
2,716,083 |
2,577,647 |
2,527,046 |
2,216,184 |
2,161,965 |
||||||||||||||
Accumulated depreciation |
(228,742 |
) |
(214,680 |
) |
(200,006 |
) |
(186,234 |
) |
(173,541 |
) |
|||||||||
Investments in real estate, net |
2,487,341 |
2,362,967 |
2,327,040 |
2,029,950 |
1,988,424 |
||||||||||||||
Cash and cash equivalents |
180,601 |
183,904 |
162,704 |
15,625 |
6,620 |
||||||||||||||
Restricted cash |
— |
— |
— |
4,211 |
250 |
||||||||||||||
Rents and other receivables, net |
4,944 |
5,042 |
3,920 |
3,328 |
3,664 |
||||||||||||||
Deferred rent receivable, net |
22,228 |
20,770 |
19,432 |
17,766 |
15,826 |
||||||||||||||
Deferred leasing costs, net |
14,002 |
13,446 |
12,600 |
12,097 |
12,014 |
||||||||||||||
Deferred loan costs, net |
1,312 |
1,467 |
1,621 |
1,775 |
1,930 |
||||||||||||||
Acquired lease intangible assets, net(1)
|
55,683 |
53,402 |
57,054 |
45,876 |
49,239 |
||||||||||||||
Acquired indefinite-lived intangible |
5,156 |
5,156 |
5,156 |
5,156 |
5,156 |
||||||||||||||
Interest rate swap asset |
8,770 |
13,851 |
13,036 |
11,294 |
7,193 |
||||||||||||||
Other assets |
6,723 |
7,508 |
8,216 |
5,961 |
6,146 |
||||||||||||||
Acquisition related deposits |
925 |
1,325 |
1,600 |
4,525 |
2,475 |
||||||||||||||
Assets associated with real estate held for sale, net(2)
|
— |
— |
— |
8,300 |
12,436 |
||||||||||||||
Total Assets |
$ |
2,787,685 |
$ |
2,668,838 |
$ |
2,612,379 |
$ |
2,165,864 |
$ |
2,111,373 |
|||||||||
LIABILITIES & EQUITY |
|||||||||||||||||||
Liabilities |
|||||||||||||||||||
Notes payable |
$ |
757,371 |
$ |
757,218 |
$ |
757,064 |
$ |
659,417 |
$ |
668,941 |
|||||||||
Interest rate swap liability |
2,351 |
— |
— |
— |
219 |
||||||||||||||
Accounts payable, accrued expenses and other liabilities |
21,074 |
30,411 |
19,683 |
21,441 |
21,134 |
||||||||||||||
Dividends payable |
15,938 |
15,214 |
14,952 |
13,294 |
11,727 |
||||||||||||||
Acquired lease intangible liabilities, net(3)
|
52,727 |
52,289 |
53,939 |
17,783 |
18,067 |
||||||||||||||
Tenant security deposits |
23,262 |
21,888 |
20,534 |
19,936 |
19,521 |
||||||||||||||
Prepaid rents |
6,539 |
6,424 |
6,374 |
5,540 |
6,267 |
||||||||||||||
Liabilities associated with real estate held for sale(2)
|
— |
— |
— |
132 |
243 |
||||||||||||||
Total Liabilities |
879,262 |
883,444 |
872,546 |
737,543 |
746,119 |
||||||||||||||
Equity |
|||||||||||||||||||
Series A preferred stock, net ($90,000 liquidation preference) |
86,651 |
86,651 |
86,651 |
86,651 |
86,651 |
||||||||||||||
Series B preferred stock, net ($75,000 liquidation preference) |
72,443 |
72,443 |
72,443 |
72,443 |
73,062 |
||||||||||||||
Common stock |
966 |
924 |
908 |
804 |
782 |
||||||||||||||
Additional paid in capital |
1,798,113 |
1,666,339 |
1,614,650 |
1,297,391 |
1,239,810 |
||||||||||||||
Cumulative distributions in excess of earnings |
(88,341 |
) |
(85,358 |
) |
(76,926 |
) |
(67,622 |
) |
(67,058 |
) |
|||||||||
Accumulated other comprehensive income |
6,262 |
13,558 |
12,753 |
11,014 |
6,799 |
||||||||||||||
Total stockholders’ equity |
1,876,094 |
1,754,557 |
1,710,479 |
1,400,681 |
1,340,046 |
||||||||||||||
Noncontrolling interests |
32,329 |
30,837 |
29,354 |
27,640 |
25,208 |
||||||||||||||
Total Equity |
1,908,423 |
1,785,394 |
1,739,833 |
1,428,321 |
1,365,254 |
||||||||||||||
Total Liabilities and Equity |
$ |
2,787,685 |
$ |
2,668,838 |
$ |
2,612,379 |
$ |
2,165,864 |
$ |
2,111,373 |
|||||||||
(1) |
Includes net above-market tenant lease intangibles of $4,647 (December 31, 2018), $4,453 (September 30, 2018), $4,692 (June 30, 2018), $4,899 (March 31, 2018) and $5,223 (December 31, 2017).
|
(2) |
At March 31, 2018, the properties located at 1910 Archibald Avenue and 1920 Archibald Avenue were classified as held for sale. At December 31, 2017, the properties located at 700 Allen Avenue, 1851 & 1830 Flower Street and 8900-8980 Benson Avenue were classified as held for sale. |
(3) |
Includes net below-market tenant lease intangibles of $52,610 (December 31, 2018), $52,164 (September 30, 2018), $53,806 (June 30, 2018), $17,642 (March 31, 2018) and $17,919 (December 31, 2017).
|
|
Fourth Quarter 2018
Supplemental Financial Reporting Package
|
Page 5
|
|
|
Consolidated Statements of Operations.
|
||
Quarterly Results |
(unaudited and in thousands, except share and per share data) |
|
Three Months Ended |
|||||||||||||||||||
December 31, 2018 |
September 30, 2018 |
June 30, 2018 |
March 31, 2018 |
December 31, 2017 |
|||||||||||||||
Rental Revenues |
|||||||||||||||||||
Rental income |
$ |
47,429 |
$ |
45,661 |
$ |
43,567 |
$ |
40,911 |
$ |
38,691 |
|||||||||
Tenant reimbursements |
8,462 |
8,508 |
7,932 |
7,293 |
6,757 |
||||||||||||||
Other income |
234 |
300 |
117 |
229 |
319 |
||||||||||||||
Total Rental Revenues |
56,125 |
54,469 |
51,616 |
48,433 |
45,767 |
||||||||||||||
Management, leasing, and development services |
114 |
116 |
140 |
103 |
113 |
||||||||||||||
Interest income |
769 |
609 |
— |
— |
— |
||||||||||||||
Total Revenues |
57,008 |
55,194 |
51,756 |
48,536 |
45,880 |
||||||||||||||
Operating Expenses |
|||||||||||||||||||
Property expenses |
13,642 |
13,294 |
12,775 |
11,960 |
12,152 |
||||||||||||||
General and administrative |
6,297 |
6,229 |
6,506 |
6,162 |
5,558 |
||||||||||||||
Depreciation and amortization |
20,671 |
20,144 |
19,775 |
19,452 |
18,767 |
||||||||||||||
Total Operating Expenses |
40,610 |
39,667 |
39,056 |
37,574 |
36,477 |
||||||||||||||
Other Expenses |
|||||||||||||||||||
Acquisition expenses |
166 |
106 |
37 |
9 |
33 |
||||||||||||||
Interest expense |
6,656 |
6,456 |
6,452 |
5,852 |
5,638 |
||||||||||||||
Total Other Expenses |
6,822 |
6,562 |
6,489 |
5,861 |
5,671 |
||||||||||||||
Total Expenses |
47,432 |
46,229 |
45,545 |
43,435 |
42,148 |
||||||||||||||
Gain on extinguishment of debt |
— |
— |
— |
— |
47 |
||||||||||||||
Gains on sale of real estate |
5,631 |
— |
1,608 |
9,983 |
10,336 |
||||||||||||||
Net Income |
15,207 |
8,965 |
7,819 |
15,084 |
14,115 |
||||||||||||||
Less: net income attributable to noncontrolling interest |
(277 |
) |
(141 |
) |
(129 |
) |
(318 |
) |
(304 |
) |
|||||||||
Net income attributable to Rexford Industrial Realty, Inc. |
14,930 |
8,824 |
7,690 |
14,766 |
13,811 |
||||||||||||||
Less: preferred stock dividends |
(2,424 |
) |
(2,423 |
) |
(2,424 |
) |
(2,423 |
) |
(1,909 |
) |
|||||||||
Less: earnings allocated to participating securities |
(93 |
) |
(94 |
) |
(94 |
) |
(97 |
) |
(83 |
) |
|||||||||
Net income attributable to common stockholders |
$ |
12,413 |
$ |
6,307 |
$ |
5,172 |
$ |
12,246 |
$ |
11,819 |
|||||||||
Earnings per Common Share |
|||||||||||||||||||
Net income attributable to common stockholders per share - basic |
$ |
0.13 |
$ |
0.07 |
$ |
0.06 |
$ |
0.16 |
$ |
0.15 |
|||||||||
Net income attributable to common stockholders per share - diluted |
$ |
0.13 |
$ |
0.07 |
$ |
0.06 |
$ |
0.15 |
$ |
0.15 |
|||||||||
Weighted average shares outstanding - basic |
93,995,846 |
91,463,594 |
82,924,208 |
78,694,161 |
77,771,084 |
||||||||||||||
Weighted average shares outstanding - diluted |
94,487,773 |
91,945,206 |
83,494,825 |
79,196,060 |
78,227,824 |
||||||||||||||
|
Fourth Quarter 2018
Supplemental Financial Reporting Package
|
Page 6
|
|
|
Consolidated Statements of Operations.
|
||
Quarterly Results |
(unaudited and in thousands) |
|
Three Months Ended December 31, |
Year Ended December 31, |
||||||||||||||
2018 |
2017 |
2018 |
2017 |
||||||||||||
Rental Revenues |
|||||||||||||||
Rental income |
$ |
47,429 |
$ |
38,691 |
$ |
177,568 |
$ |
136,185 |
|||||||
Tenant reimbursements |
8,462 |
6,757 |
32,195 |
23,363 |
|||||||||||
Other income |
234 |
319 |
880 |
869 |
|||||||||||
Total Rental Revenues |
56,125 |
45,767 |
210,643 |
160,417 |
|||||||||||
Management, leasing, and development services |
114 |
113 |
473 |
493 |
|||||||||||
Interest income |
769 |
— |
1,378 |
445 |
|||||||||||
Total Revenues |
57,008 |
45,880 |
212,494 |
161,355 |
|||||||||||
Operating Expenses |
|||||||||||||||
Property expenses |
13,642 |
12,152 |
51,671 |
42,139 |
|||||||||||
General and administrative |
6,297 |
5,558 |
25,194 |
21,610 |
|||||||||||
Depreciation and amortization |
20,671 |
18,767 |
80,042 |
64,852 |
|||||||||||
Total Operating Expenses |
40,610 |
36,477 |
156,907 |
128,601 |
|||||||||||
Other Expenses |
|||||||||||||||
Acquisition expenses |
166 |
33 |
318 |
454 |
|||||||||||
Interest expense |
6,656 |
5,638 |
25,416 |
20,209 |
|||||||||||
Total Other Expenses |
6,822 |
5,671 |
25,734 |
20,663 |
|||||||||||
Total Expenses |
47,432 |
42,148 |
182,641 |
149,264 |
|||||||||||
Equity in income from unconsolidated real estate entities |
— |
— |
— |
11 |
|||||||||||
Gains on extinguishment of debt |
— |
47 |
— |
25 |
|||||||||||
Gains on sale of real estate |
5,631 |
10,336 |
17,222 |
29,573 |
|||||||||||
Net Income |
15,207 |
14,115 |
47,075 |
41,700 |
|||||||||||
Less: net income attributable to noncontrolling interest |
(277 |
) |
(304 |
) |
(865 |
) |
(988 |
) |
|||||||
Net income attributable to Rexford Industrial Realty, Inc. |
14,930 |
13,811 |
46,210 |
40,712 |
|||||||||||
Less: preferred stock dividends |
(2,424 |
) |
(1,909 |
) |
(9,694 |
) |
(5,875 |
) |
|||||||
Less: earnings allocated to participating securities |
(93 |
) |
(83 |
) |
(378 |
) |
(410 |
) |
|||||||
Net income attributable to common stockholders |
$ |
12,413 |
$ |
11,819 |
$ |
36,138 |
$ |
34,427 |
|||||||
|
Fourth Quarter 2018
Supplemental Financial Reporting Package
|
Page 7
|
|
|
Non-GAAP FFO and Core FFO Reconciliations. (1)
|
||
(unaudited and in thousands, except share and per share data) |
||
Three Months Ended |
|||||||||||||||||||
December 31, 2018 |
September 30, 2018 |
June 30, 2018 |
March 31, 2018 |
December 31, 2017 |
|||||||||||||||
Net Income |
$ |
15,207 |
$ |
8,965 |
$ |
7,819 |
$ |
15,084 |
$ |
14,115 |
|||||||||
Add: |
|||||||||||||||||||
Depreciation and amortization |
20,671 |
20,144 |
19,775 |
19,452 |
18,767 |
||||||||||||||
Deduct: |
|||||||||||||||||||
Gains on sale of real estate |
5,631 |
— |
1,608 |
9,983 |
10,336 |
||||||||||||||
Funds From Operations (FFO) |
30,247 |
29,109 |
25,986 |
24,553 |
22,546 |
||||||||||||||
Less: preferred stock dividends |
(2,424 |
) |
(2,423 |
) |
(2,424 |
) |
(2,423 |
) |
(1,909 |
) |
|||||||||
Less: FFO attributable to noncontrolling interests(2)
|
(602 |
) |
(574 |
) |
(562 |
) |
(557 |
) |
(506 |
) |
|||||||||
Less: FFO attributable to participating securities(3)
|
(166 |
) |
(165 |
) |
(153 |
) |
(158 |
) |
(138 |
) |
|||||||||
Company share of FFO |
$ |
27,055 |
$ |
25,947 |
$ |
22,847 |
$ |
21,415 |
$ |
19,993 |
|||||||||
Company share of FFO per common share‐basic |
$ |
0.29 |
$ |
0.28 |
$ |
0.28 |
$ |
0.27 |
$ |
0.26 |
|||||||||
Company share of FFO per common share‐diluted |
$ |
0.29 |
$ |
0.28 |
$ |
0.27 |
$ |
0.27 |
$ |
0.26 |
|||||||||
FFO |
$ |
30,247 |
$ |
29,109 |
$ |
25,986 |
$ |
24,553 |
$ |
22,546 |
|||||||||
Adjust: |
|||||||||||||||||||
Acquisition expenses |
166 |
106 |
37 |
9 |
33 |
||||||||||||||
Core FFO |
30,413 |
29,215 |
26,023 |
24,562 |
22,579 |
||||||||||||||
Less: preferred stock dividends |
(2,424 |
) |
(2,423 |
) |
(2,424 |
) |
(2,423 |
) |
(1,909 |
) |
|||||||||
Less: Core FFO attributable to noncontrolling interests(2)
|
(606 |
) |
(576 |
) |
(563 |
) |
(557 |
) |
(507 |
) |
|||||||||
Less: Core FFO attributable to participating securities(3)
|
(167 |
) |
(166 |
) |
(154 |
) |
(158 |
) |
(138 |
) |
|||||||||
Company share of Core FFO |
$ |
27,216 |
$ |
26,050 |
$ |
22,882 |
$ |
21,424 |
$ |
20,025 |
|||||||||
Company share of Core FFO per common share‐basic |
$ |
0.29 |
$ |
0.28 |
$ |
0.28 |
$ |
0.27 |
$ |
0.26 |
|||||||||
Company share of Core FFO per common share‐diluted |
$ |
0.29 |
$ |
0.28 |
$ |
0.27 |
$ |
0.27 |
$ |
0.26 |
|||||||||
Weighted-average shares outstanding-basic |
93,995,846 |
91,463,594 |
82,924,208 |
78,694,161 |
77,771,084 |
||||||||||||||
Weighted-average shares outstanding-diluted(4)
|
94,487,773 |
91,945,206 |
83,494,825 |
79,196,060 |
78,227,824 |
||||||||||||||
(1) |
For a definition and discussion of non-GAAP financial measures, see the definitions section beginning on page 25 of this report.
|
(2) |
Noncontrolling interests represent holders of outstanding common units of the Company’s operating partnership that are owned by unit holders other than us. |
(3) |
Participating securities include unvested shares of restricted stock, unvested LTIP units and unvested performance units. |
(4) |
Weighted-average shares outstanding-diluted includes adjustments for unvested performance units if the effect is dilutive for the reported period. |
|
Fourth Quarter 2018
Supplemental Financial Reporting Package
|
Page 8
|
|
|
Non-GAAP AFFO Reconciliation. (1)
|
||
(unaudited and in thousands, except share and per share data) |
||
Three Months Ended |
|||||||||||||||||||
December 31, 2018 |
September 30, 2018 |
June 30, 2018 |
March 31, 2018 |
December 31, 2017 |
|||||||||||||||
Funds From Operations(2)
|
$ |
30,247 |
$ |
29,109 |
$ |
25,986 |
$ |
24,553 |
$ |
22,546 |
|||||||||
Add: |
|||||||||||||||||||
Amortization of deferred financing costs |
345 |
344 |
332 |
311 |
294 |
||||||||||||||
Non-cash stock compensation |
2,282 |
2,244 |
2,658 |
1,727 |
1,328 |
||||||||||||||
Straight line corporate office rent expense adjustment |
(47 |
) |
(43 |
) |
(34 |
) |
(41 |
) |
(30 |
) |
|||||||||
Gain on extinguishment of debt |
— |
— |
— |
— |
(47 |
) |
|||||||||||||
Deduct: |
|||||||||||||||||||
Preferred stock dividends |
2,424 |
2,423 |
2,424 |
2,423 |
1,909 |
||||||||||||||
Straight line rental revenue adjustment(3)
|
1,492 |
1,343 |
1,673 |
1,969 |
1,478 |
||||||||||||||
Amortization of net below-market lease intangibles |
1,627 |
1,622 |
1,616 |
1,116 |
1,067 |
||||||||||||||
Capitalized payments(4)
|
1,573 |
1,677 |
1,490 |
1,252 |
1,410 |
||||||||||||||
Note payable premium amortization |
(1 |
) |
(1 |
) |
(2 |
) |
(1 |
) |
38 |
||||||||||
Recurring capital expenditures(5)
|
2,403 |
1,405 |
959 |
854 |
826 |
||||||||||||||
2nd generation tenant improvements and leasing commissions(6)
|
1,252 |
966 |
795 |
983 |
1,480 |
||||||||||||||
Adjusted Funds From Operations (AFFO) |
$ |
22,057 |
$ |
22,219 |
$ |
19,987 |
$ |
17,954 |
$ |
15,883 |
|||||||||
(1) |
For a definition and discussion of non-GAAP financial measures, see the definitions section beginning on page 25 of this report.
|
(2) |
A reconciliation of net income to Funds From Operations is set forth on page 8 of this report. |
(3) |
The straight line rental revenue adjustment includes concessions of $1,039, $914, $1,180, $1,627 and $1,029 for the three months ended December 31, 2018, September 30, 2018, June 30, 2018, March 31, 2018, and December 31, 2017, respectively.
|
(4) |
Includes capitalized interest, taxes, insurance and leasing and construction development compensation. |
(5) |
Excludes nonrecurring capital expenditures of $10,529, $14,211, $9,320, $11,392 and $11,255 for the three months ended December 31, 2018, September 30, 2018, June 30, 2018, March 31, 2018, and December 31, 2017, respectively.
|
(6) |
Excludes 1st generation tenant improvements/space preparation and leasing commissions of $1,014, $805, $630, $257 and $1,099 for the three months ended December 31, 2018, September 30, 2018, June 30, 2018, March 31, 2018, and December 31, 2017, respectively.
|
|
Fourth Quarter 2018
Supplemental Financial Reporting Package
|
Page 9
|
|
|
Statement of Operations Reconciliations - NOI, Cash NOI, EBITDAre and Adjusted EBITDA. (1)
| ||
(unaudited and in thousands) |
||
NOI and Cash NOI |
||||||||||||||||||||
Three Months Ended |
||||||||||||||||||||
Dec 31, 2018 |
Sep 30, 2018 |
Jun 30, 2018 |
Mar 31, 2018 |
Dec 31, 2017 |
||||||||||||||||
Rental income |
$ |
47,429 |
$ |
45,661 |
$ |
43,567 |
$ |
40,911 |
$ |
38,691 |
||||||||||
Tenant reimbursements |
8,462 |
8,508 |
7,932 |
7,293 |
6,757 |
|||||||||||||||
Other income |
234 |
300 |
117 |
229 |
319 |
|||||||||||||||
Total Rental Revenues |
56,125 |
54,469 |
51,616 |
48,433 |
45,767 |
|||||||||||||||
Property Expenses |
13,642 |
13,294 |
12,775 |
11,960 |
12,152 |
|||||||||||||||
Net Operating Income (NOI) |
$ |
42,483 |
$ |
41,175 |
$ |
38,841 |
$ |
36,473 |
$ |
33,615 |
||||||||||
Amortization of above/below market lease intangibles |
(1,627 |
) |
(1,622 |
) |
(1,616 |
) |
(1,116 |
) |
(1,067 |
) |
||||||||||
Straight line rental revenue adjustment |
(1,492 |
) |
(1,343 |
) |
(1,673 |
) |
(1,969 |
) |
(1,478 |
) |
||||||||||
Cash NOI |
$ |
39,364 |
$ |
38,210 |
$ |
35,552 |
$ |
33,388 |
$ |
31,070 |
||||||||||
EBITDAre and Adjusted EBITDA
|
|||||||||||||||||||
Three Months Ended |
|||||||||||||||||||
Dec 31, 2018 |
Sep 30, 2018 |
Jun 30, 2018 |
Mar 31, 2018 |
Dec 31, 2017 |
|||||||||||||||
Net income |
$ |
15,207 |
$ |
8,965 |
$ |
7,819 |
$ |
15,084 |
$ |
14,115 |
|||||||||
Interest expense |
6,656 |
6,456 |
6,452 |
5,852 |
5,638 |
||||||||||||||
Depreciation and amortization |
20,671 |
20,144 |
19,775 |
19,452 |
18,767 |
||||||||||||||
Gains on sale of real estate |
(5,631 |
) |
— |
(1,608 |
) |
(9,983 |
) |
(10,336 |
) |
||||||||||
EBITDAre
|
$ |
36,903 |
$ |
35,565 |
$ |
32,438 |
$ |
30,405 |
$ |
28,184 |
|||||||||
Stock-based compensation amortization |
2,282 |
2,244 |
2,658 |
1,727 |
1,328 |
||||||||||||||
Gain on extinguishment of debt |
— |
— |
— |
— |
(47 |
) |
|||||||||||||
Acquisition expenses |
166 |
106 |
37 |
9 |
33 |
||||||||||||||
Pro forma effect of acquisitions(2)
|
1,005 |
88 |
1,682 |
395 |
1,181 |
||||||||||||||
Pro forma effect of dispositions(3)
|
(8 |
) |
— |
(31 |
) |
(230 |
) |
(4 |
) |
||||||||||
Adjusted EBITDA |
$ |
40,348 |
$ |
38,003 |
$ |
36,784 |
$ |
32,306 |
$ |
30,675 |
|||||||||
(1) |
For a definition and discussion of non-GAAP financial measures, see the definitions section beginning on page 25 of this report.
|
(2) |
Represents the estimated impact on Q4’18 EBITDAre of Q4’18 acquisitions as if they had been acquired on October 1, 2018, the impact on Q3’18 EBITDAre of Q3’18 as if they had been acquired on July 1, 2018, the impact on Q2’18 EBITDAre of Q2’18 acquisitions as if they had been acquired on April 1, 2018, the impact on Q1’18 EBITDAre of Q1’18 acquisitions as if they had been acquired on January 1, 2018, and the impact on Q4’17 EBITDAre of Q4’17 acquisitions as if they had been acquired on October 1, 2017, We have made a number of assumptions in such estimates and there can be no assurance that we would have generated the projected levels of EBITDAre had we owned the acquired entities as of the beginning of each period.
|
(3) |
Represents the impact on Q4’18 EBITDAre of Q4’18 dispositions as if they had been sold as of October 1, 2018, and the impact on Q2’18 EBITDAre of Q2’18 dispositions as if they had been sold as of April 1, 2018, the impact on Q1’18 EBITDAre of Q1’18 dispositions as if they had been sold as of January 1, 2018, and the impact on Q4’17 EBITDAre of Q4’17 dispositions as if they had been sold as of October 1, 2017. See page 22 for details related to current year disposition properties.
|
|
Fourth Quarter 2018
Supplemental Financial Reporting Package
|
Page 10
|
|
|
Same Property Portfolio Performance. (1)
|
||
(unaudited and dollars in thousands) |
||
Same Property Portfolio: |
||||||||||||||||
Number of properties |
126 |
|||||||||||||||
Square Feet |
14,106,629 |
|||||||||||||||
Same Property Portfolio NOI and Cash NOI: |
||||||||||||||||||||||||||||
Three Months Ended December 31, |
Year Ended December 31, |
|||||||||||||||||||||||||||
2018 |
2017 |
$ Change |
% Change |
2018 |
2017 |
$ Change |
% Change |
|||||||||||||||||||||
Rental income(2)
|
$ |
32,765 |
$ |
30,318 |
$ |
2,447 |
8.1% |
$ |
127,628 |
$ |
117,110 |
$ |
10,518 |
9.0% |
||||||||||||||
Tenant reimbursements |
5,293 |
4,819 |
474 |
9.8% |
21,260 |
19,509 |
1,751 |
9.0% |
||||||||||||||||||||
Other income |
191 |
287 |
(96 |
) |
(33.4)% |
755 |
753 |
2 |
0.3% |
|||||||||||||||||||
Total rental revenues |
38,249 |
35,424 |
2,825 |
8.0% |
149,643 |
137,372 |
12,271 |
8.9% |
||||||||||||||||||||
Property expenses |
9,446 |
9,155 |
291 |
3.2% |
36,645 |
35,238 |
1,407 |
4.0% |
||||||||||||||||||||
Same property portfolio NOI |
$ |
28,803 |
$ |
26,269 |
$ |
2,534 |
9.6% |
(2) |
$ |
112,998 |
$ |
102,134 |
$ |
10,864 |
10.6% |
(2) |
||||||||||||
Straight-line rents |
(593 |
) |
(1,146 |
) |
553 |
(48.3)% |
(3,395 |
) |
(3,807 |
) |
412 |
(10.8)% |
||||||||||||||||
Amort. above/below market leases |
(147 |
) |
(147 |
) |
— |
0.0% |
(537 |
) |
(539 |
) |
2 |
(0.4)% |
||||||||||||||||
Same property portfolio Cash NOI |
$ |
28,063 |
$ |
24,976 |
$ |
3,087 |
12.4% |
(2) |
$ |
109,066 |
$ |
97,788 |
$ |
11,278 |
11.5% |
(2) |
||||||||||||
Stabilized same property portfolio NOI(3)
|
$ |
25,573 |
$ |
24,325 |
$ |
1,248 |
5.1% |
$ |
102,211 |
$ |
95,203 |
$ |
7,008 |
7.4% |
||||||||||||||
Stabilized same property portfolio Cash NOI(3)
|
$ |
25,220 |
$ |
23,390 |
$ |
1,830 |
7.8% |
$ |
99,854 |
$ |
91,255 |
$ |
8,599 |
9.4% |
||||||||||||||
Same Property Portfolio Occupancy: | |||||||||||
December 31, 2018 |
December 31, 2017 |
Change (basis points) |
|||||||||
Same Property Portfolio |
Stabilized Same Property Portfolio(4)
|
Same Property Portfolio |
Stabilized Same Property Portfolio(5)
|
Same Property Portfolio |
Stabilized Same Property Portfolio |
||||||
Occupancy: |
|||||||||||
Los Angeles County |
98.5% |
99.1% |
95.8% |
99.2% |
270 bps |
(10) bps |
|||||
Orange County |
94.2% |
96.7% |
96.9% |
97.6% |
(270) bps |
(90) bps |
|||||
San Bernardino County |
97.3% |
97.3% |
99.8% |
99.8% |
(250) bps |
(250) bps |
|||||
Ventura County |
90.3% |
96.9% |
84.7% |
93.8% |
560 bps |
310 bps |
|||||
San Diego County |
98.6% |
98.6% |
96.3% |
96.3% |
230 bps |
230 bps |
|||||
Total/Weighted Average |
96.7% |
98.2% |
95.3% |
98.1% |
140 bps |
10 bps |
|||||
(1) |
For a definition and discussion of non-GAAP financial measures, see the definitions section beginning on page 25 of this report.
|
(2) |
Rental income includes lease termination fees of $4 thousand and zero for the three months ended December 31, 2018 and 2017, respectively, and $176 thousand and $29 thousand for the year ended December 31, 2018 and 2017, respectively. Excluding these lease termination fees, Same Property Portfolio NOI increased by approximately 9.6% and 10.5% and Same Property Portfolio Cash NOI increased by approximately 12.3% and 11.4% during the three months and year ended December 31, 2018, compared to three months and year ended December 31, 2017, respectively.
|
(3) |
Excludes the operating results of properties under repositioning or lease-up in 2017 and 2018 (see page 27 for a list of these properties). |
(4) |
Reflects the occupancy of our Same Property Portfolio as of December 31, 2018, adjusted for space totaling 209,031 RSF at four properties that were classified as repositioning or lease-up as of December 31, 2018. For additional details, refer to pages 20-21 of this report.
|
(5) |
Reflects the occupancy of our Same Portfolio Property as of December 31, 2017, adjusted for space totaling 397,340 RSF at six properties that were classified as repositioning or lease-up as of December 31, 2017.
|
|
Fourth Quarter 2018
Supplemental Financial Reporting Package
|
Page 11
|
|
|
Capitalization Summary.
|
||
(unaudited and in thousands, except share and per share data) |
||
Capitalization as of December 31, 2018 |
||
Description |
December 31, 2018 |
September 30, 2018 |
June 30, 2018 |
March 31, 2018 |
December 31, 2017 |
|||||||||||||||
Common shares outstanding(1)
|
96,610,106 |
92,497,666 |
90,848,198 |
80,441,338 |
78,305,187 |
|||||||||||||||
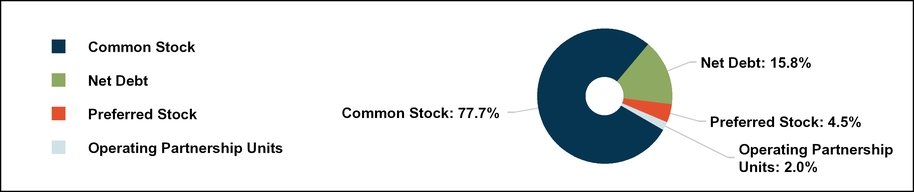
Operating partnership units outstanding(2)
|
2,415,811 |
2,003,104 |
2,013,564 |
2,041,175 |
2,018,245 |
|||||||||||||||
Total shares and units outstanding at period end |
99,025,917 |
94,500,770 |
92,861,762 |
82,482,513 |
80,323,432 |
|||||||||||||||
Share price at end of quarter |
$ |
29.47 |
$ |
31.96 |
$ |
31.39 |
$ |
28.79 |
$ |
29.16 |
||||||||||
Common Stock and Operating Partnership Units - Capitalization |
$ |
2,918,294 |
$ |
3,020,245 |
$ |
2,914,931 |
$ |
2,374,672 |
$ |
2,342,231 |
||||||||||
5.875% Series A Cumulative Redeemable Preferred Stock(3)
|
90,000 |
90,000 |
90,000 |
90,000 |
90,000 |
|||||||||||||||
5.875% Series B Cumulative Redeemable Preferred Stock(4)
|
75,000 |
75,000 |
75,000 |
75,000 |
75,000 |
|||||||||||||||
Total Equity Market Capitalization |
$ |
3,083,294 |
$ |
3,185,245 |
$ |
3,079,931 |
$ |
2,539,672 |
$ |
2,507,231 |
||||||||||
Total Debt |
$ |
761,116 |
$ |
761,154 |
$ |
761,192 |
$ |
662,425 |
$ |
671,657 |
||||||||||
Less: Cash and cash equivalents |
(180,601 |
) |
(183,904 |
) |
(162,704 |
) |
(15,625 |
) |
(6,620 |
) |
||||||||||
Net Debt |
$ |
580,515 |
$ |
577,250 |
$ |
598,488 |
$ |
646,800 |
$ |
665,037 |
||||||||||
Total Combined Market Capitalization (Net Debt plus Equity) |
$ |
3,663,809 |
$ |
3,762,495 |
$ |
3,678,419 |
$ |
3,186,472 |
$ |
3,172,268 |
||||||||||
Net debt to total combined market capitalization |
15.8 |
% |
15.3 |
% |
16.3 |
% |
20.3 |
% |
21.0 |
% |
||||||||||
Net debt to Adjusted EBITDA (quarterly results annualized)(5)
|
3.6x |
3.8x |
4.1x |
5.0x |
5.4x |
|||||||||||||||
(1) |
Excludes the following number of shares of unvested restricted stock: 200,398 (Dec 31, 2018), 209,214 (Sep 30, 2018), 213,867 (Jun 30, 2018), 226,451 (Mar 31, 2018) and 190,695 (Dec 31, 2017).
|
(2) |
Represents outstanding common units of the Company’s operating partnership, Rexford Industrial Realty, LP, that are owned by unit holders other than Rexford Industrial Realty, Inc. Represents the noncontrolling interest in our operating partnership. As of December 31, 2018, includes 269,260 vested LTIP Units and 307,986 vested performance units and excludes 327,048 unvested LTIP Units and 591,767 unvested performance units.
|
(3) |
Value based on 3,600,000 outstanding shares of preferred stock at a liquidation preference of $25.00 per share. |
(4) |
Value based on 3,000,000 outstanding shares of preferred stock at a liquidation preference of $25.00 per share. |
(5) |
For a definition and discussion of non-GAAP financial measures, see the definitions section beginning on page 25 of this report.
|
|
Fourth Quarter 2018
Supplemental Financial Reporting Package
|
Page 12
|
|
|
Debt Summary.
|
(unaudited and dollars in thousands) |
|
Debt Detail: |
||
As of December 31, 2018 |
||
Debt Description |
Maturity Date |
Stated Interest Rate |
Effective Interest Rate(1) |
Principal Balance(2)
|
Expiration Date of Effective Swaps |
|||||||
Secured Debt: |
||||||||||||
$60M Term Loan |
8/1/2023(3)
|
LIBOR+1.70% |
3.619% |
$ |
58,499 |
2/15/2019 |
||||||
Gilbert/La Palma |
3/1/2031 |
5.125% |
5.125% |
2,617 |
||||||||
Unsecured Debt: |
||||||||||||
$350M Revolving Credit Facility(4)
|
2/12/2021(5)
|
LIBOR +1.10%(6)
|
3.603% |
— |
||||||||
$100M Term Loan Facility |
2/14/2022 |
LIBOR +1.20%(6)
|
2.964% |
100,000 |
8/14/2021 |
|||||||
$225M Term Loan Facility |
1/14/2023 |
LIBOR +1.20%(6)
|
2.574% |
225,000 |
1/14/2022 |
|||||||
$150M Term Loan Facility(7)
|
5/22/2025 |
LIBOR +1.50%(6)
|
4.003% |
150,000 |
||||||||
$100M Senior Notes |
8/6/2025 |
4.29% |
4.290% |
100,000 |
||||||||
$125M Senior Notes |
7/13/2027 |
3.93% |
3.930% |
125,000 |
||||||||
3.444% |
$ |
761,116 |
||||||||||
(1) |
Includes the effect of interest rate swaps effective as of December 31, 2018, and excludes the effect of discounts, deferred loan costs and the credit facility fee.
|
(2) |
Excludes unamortized debt issuance costs and discounts aggregating $3.7 million as of December 31, 2018.
|
(3) |
One two-year extension is available, provided that certain conditions are satisfied. |
(4) |
The credit facility is subject to a facility fee which is calculated as a percentage of the total commitment amount, regardless of usage. The facility fee ranges from 0.15% to 0.30% depending on the ratio of our outstanding indebtedness to the value of our gross asset value, which is measured on a quarterly basis. |
(5) |
Two additional six-month extensions are available, provided that certain conditions are satisfied. |
(6) |
The applicable LIBOR margin ranges from 1.10% to 1.50% for the revolving credit facility, 1.20% to 1.70% for the $100M term loan facility, 1.20% to 1.70% for the $225M term loan facility and 1.50% to 2.20% for the $150M term loan facility depending on the ratio of our outstanding indebtedness to the value of our gross asset value (measured on a quarterly basis). As a result, the effective interest rate will fluctuate from period to period. |
(7) |
We have an interest rate swap that will effectively fix the $150M term loan facility at 2.7625% plus an applicable LIBOR margin from July 22, 2019 through November 22, 2024. |
Debt Composition: |
||||||||||||
Category |
Weighted Average Term Remaining (yrs)(1)
|
Stated
Interest Rate
|
Effective Interest Rate |
Balance |
% of Total |
|||||||
Fixed |
5.3 |
3.31% |
3.31% |
$ |
610,725 |
80% |
||||||
Variable |
6.4 |
LIBOR + 1.50% |
4.00% |
$ |
150,391 |
20% |
||||||
Secured |
4.9 |
3.68% |
$ |
61,116 |
8% |
|||||||
Unsecured |
5.6 |
3.42% |
$ |
700,000 |
92% |
|||||||
(1) |
The weighted average remaining term to maturity of our consolidated debt is 5.5 years.
|
Debt Maturity Schedule: |
||||||||||||||||||
Year |
Secured(1)
|
Unsecured |
Total |
% Total |
Effective Interest Rate |
|||||||||||||
2019-2021 |
$ |
— |
$ |
— |
$ |
— |
— |
% |
— |
% |
||||||||
2022 |
— |
100,000 |
100,000 |
13 |
% |
2.964 |
% |
|||||||||||
2023 |
58,499 |
225,000 |
283,499 |
37 |
% |
2.790 |
% |
|||||||||||
Thereafter |
2,617 |
375,000 |
377,617 |
50 |
% |
4.062 |
% |
|||||||||||
Total |
$ |
61,116 |
$ |
700,000 |
$ |
761,116 |
100 |
% |
3.444 |
% |
||||||||
(1) |
Excludes the effect of scheduled monthly principal payments on amortizing loans. |
|
Fourth Quarter 2018
Supplemental Financial Reporting Package
|
Page 13
|
|
|
Portfolio Overview.
|
||
At December 31, 2018 |
(unaudited results) |
|
Consolidated Portfolio: |
||
Rentable Square Feet |
Occupancy % |
In-Place ABR(2)
|
|||||||||||||||||||||||||||
Market |
# Properties |
Same Properties Portfolio |
Non-Same Properties Portfolio |
Total Portfolio |
Same Properties Portfolio |
Non-Same Properties Portfolio |
Total Portfolio |
Total Portfolio Excluding Repositioning(1)
|
Total
(in 000’s)
|
Per Square Foot |
|||||||||||||||||||
Central LA |
9 |
387,310 |
920,058 |
1,307,368 |
100.0 |
% |
100.0 |
% |
100.0 |
% |
100.0 |
% |
$ |
12,030 |
$9.20 |
||||||||||||||
Greater San Fernando Valley |
30 |
2,623,257 |
559,188 |
3,182,445 |
100.0 |
% |
87.8 |
% |
97.8 |
% |
100.0 |
% |
30,680 |
$9.86 |
|||||||||||||||
Mid-Counties |
13 |
672,090 |
474,853 |
1,146,943 |
98.2 |
% |
97.5 |
% |
97.9 |
% |
99.0 |
% |
10,851 |
$9.66 |
|||||||||||||||
San Gabriel Valley |
18 |
1,936,512 |
306,671 |
2,243,183 |
97.0 |
% |
100.0 |
% |
97.4 |
% |
98.7 |
% |
19,633 |
$8.99 |
|||||||||||||||
South Bay |
23 |
1,046,864 |
1,938,197 |
2,985,061 |
97.4 |
% |
87.4 |
% |
90.9 |
% |
93.5 |
% |
26,012 |
$9.59 |
|||||||||||||||
Los Angeles County |
93 |
6,666,033 |
4,198,967 |
10,865,000 |
98.5 |
% |
92.3 |
% |
96.1 |
% |
97.8 |
% |
99,206 |
$9.50 |
|||||||||||||||
North Orange County |
9 |
875,061 |
189,355 |
1,064,416 |
94.1 |
% |
100.0 |
% |
95.1 |
% |
95.1 |
% |
9,208 |
$9.09 |
|||||||||||||||
OC Airport |
7 |
601,782 |
37,592 |
639,374 |
86.5 |
% |
100.0 |
% |
87.3 |
% |
96.2 |
% |
5,926 |
$10.61 |
|||||||||||||||
South Orange County |
3 |
329,458 |
— |
329,458 |
100.0 |
% |
— |
% |
100.0 |
% |
100.0 |
% |
3,065 |
$9.30 |
|||||||||||||||
West Orange County |
5 |
493,730 |
156,546 |
650,276 |
100.0 |
% |
100.0 |
% |
100.0 |
% |
100.0 |
% |
5,577 |
$8.58 |
|||||||||||||||
Orange County |
24 |
2,300,031 |
383,493 |
2,683,524 |
94.2 |
% |
100.0 |
% |
95.1 |
% |
97.2 |
% |
23,776 |
$9.32 |
|||||||||||||||
Inland Empire East |
1 |
51,867 |
— |
51,867 |
100.0 |
% |
— |
% |
100.0 |
% |
100.0 |
% |
345 |
$6.65 |
|||||||||||||||
Inland Empire West |
19 |
1,663,267 |
1,989,092 |
3,652,359 |
97.2 |
% |
96.5 |
% |
96.8 |
% |
96.8 |
% |
26,780 |
$7.57 |
|||||||||||||||
San Bernardino County |
20 |
1,715,134 |
1,989,092 |
3,704,226 |
97.3 |
% |
96.5 |
% |
96.9 |
% |
96.9 |
% |
27,125 |
$7.56 |
|||||||||||||||
Ventura |
15 |
1,605,785 |
188,676 |
1,794,461 |
90.3 |
% |
73.5 |
% |
88.6 |
% |
97.2 |
% |
14,079 |
$8.86 |
|||||||||||||||
Ventura County |
15 |
1,605,785 |
188,676 |
1,794,461 |
90.3 |
% |
73.5 |
% |
88.6 |
% |
97.2 |
% |
14,079 |
$8.86 |
|||||||||||||||
Central San Diego |
12 |
1,103,947 |
— |
1,103,947 |
99.2 |
% |
— |
% |
99.2 |
% |
99.2 |
% |
13,322 |
$12.17 |
|||||||||||||||
North County San Diego |
11 |
638,998 |
428,586 |
1,067,584 |
98.3 |
% |
80.6 |
% |
91.2 |
% |
95.8 |
% |
10,101 |
$10.38 |
|||||||||||||||
South County San Diego |
1 |
76,701 |
— |
76,701 |
93.3 |
% |
— |
% |
93.3 |
% |
93.3 |
% |
690 |
$9.64 |
|||||||||||||||
San Diego County |
24 |
1,819,646 |
428,586 |
2,248,232 |
98.6 |
% |
80.6 |
% |
95.2 |
% |
97.4 |
% |
24,113 |
$11.27 |
|||||||||||||||
CONSOLIDATED TOTAL / WTD AVG |
176 |
14,106,629 |
7,188,814 |
21,295,443 |
96.7 |
% |
92.7 |
% |
95.4 |
% |
97.5 |
% |
$ |
188,299 |
$9.27 |
||||||||||||||
(1) |
Excludes space aggregating 460,582 square feet at nine of our properties that were in various stages of repositioning or lease-up as of December 31, 2018. See pages 20-21 for additional details on these properties.
|
(2) |
See page 25 for definition and details on how these amounts are calculated. |
|
Fourth Quarter 2018
Supplemental Financial Reporting Package
|
Page 14
|
|
|
Occupancy and Leasing Trends.
|
||
(unaudited results, data represents consolidated portfolio only) |
||
Occupancy by County: |
||
Dec 31, 2018 |
Sep 30, 2018 |
Jun 30, 2018 |
Mar 31, 2018 |
Dec 31, 2017 |
||||||
Occupancy:(1)
|
||||||||||
Los Angeles County |
96.1% |
95.1% |
95.5% |
95.8% |
95.3% |
|||||
Orange County |
95.1% |
95.1% |
95.0% |
94.1% |
97.1% |
|||||
San Bernardino County |
96.9% |
96.5% |
96.8% |
97.8% |
99.4% |
|||||
Ventura County |
88.6% |
89.0% |
87.8% |
87.1% |
86.0% |
|||||
San Diego County |
95.2% |
97.9% |
97.4% |
95.8% |
96.3% |
|||||
Total/Weighted Average |
95.4% |
95.1% |
95.2% |
95.2% |
95.5% |
|||||
Consolidated Portfolio SF |
21,295,443 |
20,505,157 |
20,213,729 |
18,741,304 |
18,476,809 |
|||||
Leasing Activity: |
||||||||||
Three Months Ended |
||||||||||
Dec 31, 2018 |
Sep 30, 2018 |
Jun 30, 2018 |
Mar 31, 2018 |
Dec 31, 2017 |
||||||
Leasing Activity (SF):(2)
|
||||||||||
New leases(3)
|
168,758 |
583,257 |
300,591 |
281,844 |
506,581 |
|||||
Renewal leases(3)
|
463,065 |
360,430 |
542,902 |
566,551 |
574,522 |
|||||
Gross leasing |
631,823 |
943,687 |
843,493 |
848,395 |
1,081,103 |
|||||
Expiring leases |
706,693 |
733,237 |
767,362 |
847,706 |
935,035 |
|||||
Expiring leases - placed into repositioning |
18,957 |
49,166 |
66,584 |
65,762 |
124,470 |
|||||
Net absorption |
(93,827) |
161,284 |
9,547 |
(65,073) |
21,598 |
|||||
Retention rate(4)
|
67% |
55% |
71% |
68% |
64% |
|||||
Weighted Average New / Renewal Leasing Spreads: |
||||||||||
Three Months Ended |
||||||||||
Dec 31, 2018 |
Sep 30, 2018 |
Jun 30, 2018 |
Mar 31, 2018 |
Dec 31, 2017 |
||||||
GAAP Rent Change |
25.1% |
32.2% |
35.5% |
25.3% |
27.7% |
|||||
Cash Rent Change |
14.8% |
21.1% |
23.9% |
14.9% |
18.9% |
|||||
(1) |
See page 14 for the occupancy by county of our total consolidated portfolio excluding repositioning space. |
(2) |
Excludes month-to-month tenants. |
(3) |
Renewal leasing activity for Q4'18, Q3'18, Q2'18, Q1'18 and Q4'17 excludes relocations/expansions within Rexford’s portfolio totaling 7,537, 42,716, zero, 13,608 and 27,222 rentable square feet, respectively, which are included as part of new leasing activity.
|
(4) |
Retention rate is calculated as renewal lease square footage plus relocation/expansion square footage noted in (3) above, divided by expiring lease square footage (excluding expiring lease square footage placed into repositioning). |
|
Fourth Quarter 2018
Supplemental Financial Reporting Package
|
Page 15
|
|
|
Leasing Statistics.
|
||
(unaudited results, data represents consolidated portfolio only) |
||
Leasing Activity: |
||
# Leases Signed |
SF of Leasing |
Weighted Average Lease Term (Years) |
||||
Fourth Quarter 2018: |
||||||
New |
39 |
168,758 |
4.1 |
|||
Renewal |
51 |
463,065 |
3.8 |
|||
Total/Weighted Average |
90 |
631,823 |
3.9 |
|||
Change in Annual Rental Rates and Turnover Costs for Current Quarter Leases: |
||||||||||||||||
GAAP Rent |
Cash Rent |
|||||||||||||||
Fourth Quarter 2018: |
Current Lease |
Prior Lease |
Rent Change - GAAP |
Weighted Average Abatement (Months) |
Starting Cash Rent - Current Lease |
Expiring Cash Rent - Prior Lease |
Rent Change - Cash |
Turnover Costs per SF(3)
|
||||||||
New(1)
|
$13.04 |
$10.36 |
25.8% |
0.9 |
$12.68 |
$10.92 |
16.0% |
$5.94 |
||||||||
Renewal(2)
|
$11.53 |
$9.23 |
24.9% |
0.6 |
$11.21 |
$9.80 |
14.4% |
$0.62 |
||||||||
Weighted Average |
$11.87 |
$9.49 |
25.1% |
0.7 |
$11.55 |
$10.06 |
14.8% |
$1.84 |
||||||||
Uncommenced Leases by County: |
||||||||||||
Market |
Uncommenced Renewal Leases: Leased SF(4)
|
Uncommenced
New Leases:
Leased SF(4)
|
Percent Leased |
ABR Under Uncommenced Leases
(in thousands)(5)(6)
|
In-Place + Uncommenced ABR
(in thousands)(5)(6)
|
In-Place + Uncommenced ABR
per SF(6)
|
||||||
Los Angeles County |
492,937 |
— |
96.1% |
$634 |
$99,840 |
$9.56 |
||||||
Orange County |
17,516 |
— |
95.1% |
19 |
23,795 |
$9.33 |
||||||
San Bernardino County |
102,189 |
26,506 |
97.6% |
563 |
27,688 |
$7.66 |
||||||
San Diego County |
147,199 |
— |
95.2% |
101 |
24,214 |
$11.32 |
||||||
Ventura County |
77,093 |
5,266 |
88.9% |
161 |
14,240 |
$8.93 |
||||||
Total/Weighted Average |
836,934 |
31,772 |
95.5% |
$1,478 |
$189,777 |
$9.33 |
||||||
(1) |
GAAP and cash rent statistics and turnover costs for new leases exclude seven leases aggregating 35,564 rentable square feet for which there was no comparable lease data. Of these seven excluded leases, one lease for 18,490 rentable square feet relates to a repositioning/redevelopment property. Comparable leases generally exclude: (i) space that has never been occupied under our ownership, (ii) repositioned/redeveloped space, (iii) space that has been vacant for over one year or (iv) lease terms shorter than six months.
|
(2) |
GAAP and cash rent statistics and turnover costs for renewal leases excludes two leases aggregating 16,050 rentable square feet for which there was no comparable lease data, due to either (i) space with different lease structures or (ii) lease terms shorter than six months.
|
(3) |
Turnover costs include estimated tenant improvement and leasing costs associated with leases executed during the current period. Excludes costs for first generation leases. |
(4) |
Reflects the square footage of renewal and new leases, respectively, that have been signed but have not yet commenced as of December 31, 2018.
|
(5) |
Includes $333 thousand of annualized base rent under Uncommenced New Leases and $1,145 thousand of incremental annualized base rent under Uncommenced Renewal Leases.
|
(6) |
See page 25 for further details on how these amounts are calculated. |
|
Fourth Quarter 2018
Supplemental Financial Reporting Package
|
Page 16
|
|
|
Leasing Statistics (Continued).
|
||
(unaudited results, data represents consolidated portfolio only) |
||
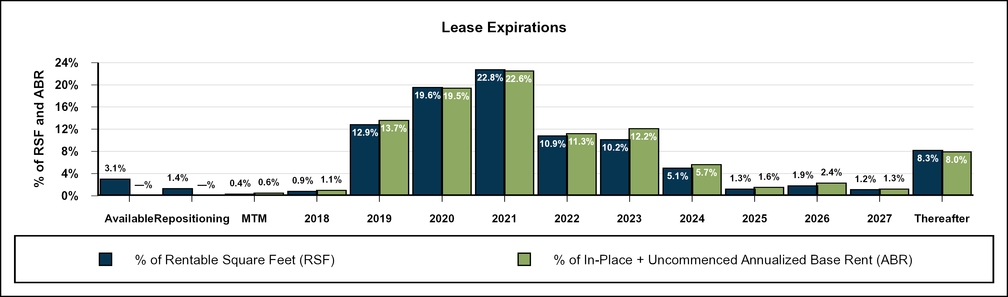
Lease Expiration Schedule as of December 31, 2018: |
||
Year of Lease Expiration |
# of Leases Expiring |
Total Rentable SF |
In-Place +
Uncommenced ABR
(in thousands)
|
In-Place + Uncommenced
ABR per SF
|
||||||
Available |
— |
663,118 |
$ |
— |
$— |
|||||
Current Repositioning(1)
|
— |
290,309 |
— |
$— |
||||||
MTM Tenants |
68 |
78,064 |
1,113 |
$14.26 |
||||||
2018 |
22 |
201,741 |
2,104 |
$10.43 |
||||||
2019 |
305 |
2,751,675 |
25,984 |
$9.44 |
||||||
2020 |
350 |
4,179,390 |
36,944 |
$8.84 |
||||||
2021 |
293 |
4,855,514 |
42,787 |
$8.81 |
||||||
2022 |
145 |
2,322,507 |
21,481 |
$9.25 |
||||||
2023 |
121 |
2,162,941 |
23,202 |
$10.73 |
||||||
2024 |
35 |
1,079,561 |
10,822 |
$10.02 |
||||||
2025 |
11 |
269,578 |
3,026 |
$11.23 |
||||||
2026 |
8 |
409,574 |
4,542 |
$11.09 |
||||||
2027 |
7 |
252,538 |
2,499 |
$9.90 |
||||||
Thereafter |
12 |
1,778,933 |
15,273 |
$8.59 |
||||||
Total Portfolio |
1,377 |
21,295,443 |
$ |
189,777 |
$9.33 |
|||||
(1) |
Represents space at seven of our properties that were classified as current repositioning as of December 31, 2018. Excludes completed repositioning properties, properties in lease-up and future repositioning properties. See pages 20-21 for additional details on these properties.
|
|
Fourth Quarter 2018
Supplemental Financial Reporting Package
|
Page 17
|
|
|
Top Tenants and Lease Segmentation.
|
||
(unaudited results, data represents consolidated portfolio only) |
||
Top 10 Tenants: |
||
Tenant |
Submarket |
Leased
Rentable SF
|
% of In-Place + Uncommenced ABR |
In-Place + Uncommenced ABR
per SF
|
Lease Expiration |
|||||
Unified Natural Foods, Inc. |
Central LA |
695,120 |
2.8% |
$7.50 |
5/8/2038 |
|||||
Federal Express Corporation |
South Bay |
173,596 |
1.3% |
$14.26 |
11/30/2032(1)
|
|||||
32 Cold, LLC |
Central LA |
149,157 |
1.2% |
$15.08 |
3/31/2026(2)
|
|||||
Cosmetic Laboratories of America, LLC |
Greater San Fernando Valley |
319,348 |
1.1% |
$6.28 |
6/30/2020 |
|||||
Triscenic Production Services, Inc. |
Greater San Fernando Valley |
255,303 |
1.0% |
$7.77 |
3/31/2022(3)
|
|||||
Universal Technical Institute of Southern California, LLC |
South Bay |
142,593 |
1.0% |
$13.69 |
8/31/2030 |
|||||
Southland Industries, Inc. |
West Orange County |
207,953 |
1.0% |
$9.00 |
5/31/2028 |
|||||
Tesla, Inc. |
Greater San Fernando Valley |
167,425 |
0.8% |
$9.12 |
8/31/2022(4)
|
|||||
Warehouse Specialists, Inc. |
San Gabriel Valley |
245,961 |
0.8% |
$6.18 |
2/28/2021 |
|||||
Dendreon Corporation |
West Orange County |
170,865 |
0.8% |
$8.87 |
12/31/2019 |
|||||
Top 10 Total / Weighted Average |
2,527,321 |
11.8% |
$8.83 |
|||||||
(1) |
Includes (i) 30,160 rentable square feet expiring September 30, 2027, and (ii) 143,436 rentable square feet expiring November 30, 2032.
|
(2) |
Includes (i) 78,280 rentable square feet expiring September 30, 2025, and (ii) 70,877 rentable square feet expiring March 31, 2026.
|
(3) |
Includes (i) 38,766 rentable square feet expiring November 30, 2019, (ii) 147,318 rentable square feet expiring September 30, 2021, and (iii) 69,219 rentable square feet expiring March 31, 2022.
|
(4) |
Includes (i) 16,868 rentable square feet expiring April 30, 2020, (ii) 21,697 rentable square feet expiring November 30, 2019, (iii) 20,310 rentable square feet expiring May 31, 2020, and (iv) 108,550 rentable square feet expiring August 31, 2022.
|
Lease Segmentation by Size: |
||||||||||||||||||
Square Feet |
Number of Leases |
Leased Rentable SF |
Rentable SF |
Leased % |
Leased % Excluding Repositioning |
In-Place + Uncommenced ABR
(in thousands)(1)
|
% of In-Place + Uncommenced ABR |
In-Place + Uncommenced ABR
per SF(1)
|
||||||||||
<4,999 |
760 |
1,620,113 |
1,685,904 |
96.1% |
96.1% |
$ |
20,688 |
10.9% |
$12.77 |
|||||||||
5,000 - 9,999 |
198 |
1,401,500 |
1,468,626 |
95.4% |
97.3% |
16,328 |
8.6% |
$11.65 |
||||||||||
10,000 - 24,999 |
239 |
3,806,372 |
4,119,616 |
92.4% |
95.7% |
40,523 |
21.4% |
$10.65 |
||||||||||
25,000 - 49,999 |
86 |
3,070,590 |
3,339,162 |
92.0% |
96.6% |
29,627 |
15.6% |
$9.65 |
||||||||||
>50,000 |
94 |
10,443,441 |
10,682,135 |
97.8% |
98.9% |
82,611 |
43.5% |
$7.91 |
||||||||||
Total / Weighted Average |
1,377 |
20,342,016 |
21,295,443 |
95.5% |
97.6% |
$ |
189,777 |
100.0% |
$9.33 |
|||||||||
(1) |
See page 25 for further details on how these amounts are calculated. |
|
Fourth Quarter 2018
Supplemental Financial Reporting Package
|
Page 18
|
|
|
Capital Expenditure Summary.
|
||
(unaudited results, in thousands, except square feet and per square foot data) | ||
Twelve Months Ended December 31, 2018 |
||
Year to Date |
||||||||||||||||||||||||||
Q4-2018 |
Q3-2018 |
Q2-2018 |
Q1-2018 |
Total |
SF(1)
|
PSF |
||||||||||||||||||||
Tenant Improvements and Space Preparation: |
||||||||||||||||||||||||||
New Leases‐1st Generation |
$ |
460 |
$ |
127 |
$ |
4 |
$ |
139 |
$ |
730 |
406,400 |
$ |
1.80 |
|||||||||||||
New Leases‐2nd Generation |
$ |
358 |
$ |
21 |
$ |
187 |
$ |
278 |
844 |
450,229 |
$ |
1.87 |
||||||||||||||
Renewals |
$ |
96 |
$ |
82 |
$ |
57 |
$ |
74 |
309 |
439,921 |
$ |
0.70 |
||||||||||||||
Total Tenant Improvements and Space Preparation |
914 |
230 |
248 |
491 |
$ |
1,883 |
||||||||||||||||||||
Leasing Commissions & Lease Costs: |
||||||||||||||||||||||||||
New Leases‐1st Generation |
$ |
554 |
$ |
678 |
$ |
626 |
$ |
118 |
$ |
1,976 |
662,197 |
$ |
2.98 |
|||||||||||||
New Leases‐2nd Generation |
$ |
440 |
$ |
705 |
$ |
270 |
$ |
549 |
1,964 |
765,414 |
$ |
2.57 |
||||||||||||||
Renewals |
$ |
358 |
$ |
158 |
$ |
281 |
$ |
82 |
879 |
1,032,207 |
$ |
0.85 |
||||||||||||||
Total Leasing Commissions & Lease Costs |
1,352 |
1,541 |
1,177 |
749 |
$ |
4,819 |
||||||||||||||||||||
Total Recurring Capex |
$ |
2,403 |
$ |
1,405 |
$ |
959 |
$ |
854 |
$ |
5,621 |
19,842,157 |
$ |
0.28 |
|||||||||||||
Recurring Capex % of NOI |
5.7 |
% |
3.4 |
% |
2.5 |
% |
2.3 |
% |
3.5 |
% |
||||||||||||||||
Recurring Capex % of Operating Revenue |
4.3 |
% |
2.6 |
% |
1.9 |
% |
1.8 |
% |
2.7 |
% |
||||||||||||||||
Nonrecurring Capex: |
||||||||||||||||||||||||||
Development and Repositioning(2)
|
$ |
5,629 |
$ |
9,468 |
$ |
5,079 |
$ |
7,281 |
$ |
27,457 |
||||||||||||||||
Other Repositioning(3)
|
$ |
2,555 |
3,443 |
3,581 |
3,202 |
12,781 |
||||||||||||||||||||
Other(4)
|
$ |
2,345 |
1,300 |
660 |
909 |
5,214 |
||||||||||||||||||||
Total Nonrecurring Capex |
$ |
10,529 |
$ |
14,211 |
$ |
9,320 |
$ |
11,392 |
$ |
45,452 |
14,142,110 |
$ |
3.21 |
|||||||||||||
Other Capitalized Costs(5)
|
$ |
1,644 |
$ |
1,750 |
$ |
1,550 |
$ |
1,303 |
$ |
6,247 |
||||||||||||||||
(1) |
For tenant improvements and leasing commissions, reflects the aggregate square footage of the leases in which we incurred such costs, excluding new/renewal leases in which there were no tenant improvements and/or leasing commissions. For recurring capex, reflects the weighted average square footage of our consolidated portfolio for the period (including properties that were sold during the period). For nonrecurring capex, reflects the aggregate square footage of the properties in which we incurred such capital expenditures. |
(2) |
Includes capital expenditures related to properties that were under development or repositioning as of December 31, 2018. For details on these properties see pages 20-21.
|
(3) |
Includes capital expenditures related to other space under repositioning or renovation that are not included on pages 20-21 due to smaller space size or limited downtime for completion. |
(4) |
Includes other nonrecurring capital expenditures including, but not limited to, costs incurred for replacements of either roof or parking lots, and ADA related construction. |
(5) |
Includes the following capitalized costs: (i) compensation costs of personnel directly responsible for and who spend their time on (a) development, renovation and rehabilitation activity and (b) leasing activity and (ii) interest, property taxes and insurance costs incurred during the development and construction periods of repositioning or development projects. |
|
Fourth Quarter 2018
Supplemental Financial Reporting Package
|
Page 19
|
|
|
Properties and Space Under Repositioning. (1)
|
||
As of December 31, 2018 |
(unaudited results, in thousands, except square feet) |
|
Repositioning Properties | ||||||||||||||||||||||||||||||||||||||||||||
Same Property Portfolio |
Estimated Construction Period |
|||||||||||||||||||||||||||||||||||||||||||
Property (Submarket) |
Total Property Rentable
Square Feet
|
Space Under Repo/ Lease-Up |
Est. New Dev. Rentable Square
Feet(2)
|
Total Property Leased % 12/31/18 |
2018 |
2019 |
Start |
Target Completion |
Est. Period until
Stabilized
(months)(3)
|
Purchase
Price(4)
|
Projected Repo Costs |
Projected Total Investment(5) |
Cumulative
Investment
to Date(6)
|
Actual Quarterly
Cash NOI
4Q-2018(7) |
Est. Annual
Stabilized
Cash
NOI(8)
|
|||||||||||||||||||||||||||||
CURRENT REPOSITIONING: |
||||||||||||||||||||||||||||||||||||||||||||
28903 Ave. Paine - Dev. (SF Valley) |
— |
— |
115,817 |
0% |
N |
N |
2Q-2019 |
1Q-2020 |
15 - 18 |
$ |
5,515 |
$ |
9,275 |
$ |
14,790 |
$ |
5,763 |
$ |
— |
$ |
966 |
|||||||||||||||||||||||
851 Lawrence Drive (Ventura) |
49,976 |
49,976 |
39,294 |
(9) |
0% |
N |
N |
2Q-2018 |
1Q-2020 |
15 - 18 |
$ |
6,663 |
$ |
9,723 |
$ |
16,386 |
$ |
6,835 |
$ |
(13 |
) |
$ |
979 |
|||||||||||||||||||||
1998 Surveyor Avenue (Ventura) |
— |
— |
56,306 |
(10) |
100% |
N |
N |
2Q-2018 |
1Q-2019 |
1 (10)
|
$ |
5,918 |
$ |
4,735 |
$ |
10,652 |
$ |
10,107 |
$ |
(2 |
) |
$ |
606 |
|||||||||||||||||||||
9615 Norwalk Blvd. (Mid-Counties) |
38,362 |
12,000 |
189,808 |
(11) |
69% |
Y |
Y |
3Q-2018 |
2Q-2021 |
30 - 34 |
$ |
9,642 |
$ |
14,803 |
$ |
24,445 |
$ |
10,286 |
$ |
235 |
$ |
1,556 |
||||||||||||||||||||||
29003 Avenue Sherman (SF Valley) |
68,123 |
68,123 |
— |
0% |
N |
N |
3Q-2018 |
2Q-2019 |
4 - 6 |
$ |
9,531 |
$ |
1,338 |
$ |
10,868 |
$ |
9,569 |
$ |
(7 |
) |
$ |
560 |
||||||||||||||||||||||
1332-1340 Rocky Pt. Dr. (North SD) |
73,747 |
51,081 |
— |
31% |
N |
N |
4Q-2018 |
2Q-2019 |
6 - 9 |
$ |
10,229 |
$ |
861 |
$ |
11,090 |
$ |
10,229 |
$ |
25 |
$ |
637 |
|||||||||||||||||||||||
TOTAL/WEIGHTED AVERAGE |
230,208 |
181,180 |
401,225 |
$ |
47,498 |
$ |
40,735 |
$ |
88,231 |
$ |
52,789 |
$ |
238 |
(12) |
$ |
5,304 |
||||||||||||||||||||||||||||
LEASE-UP: |
||||||||||||||||||||||||||||||||||||||||||||
14750 Nelson (San Gabriel Valley) |
201,990 |
29,100 |
— |
86% |
Y |
Y |
3Q-2016 |
3Q-2018 |
1 - 5 |
$ |
15,000 |
$ |
15,505 |
$ |
30,505 |
$ |
30,244 |
$ |
225 |
$ |
2,452 |
|||||||||||||||||||||||
15401 Figueroa Street (South Bay) |
38,584 |
38,584 |
— |
0% |
N |
Y |
2Q-2018 |
3Q-2018 |
3 - 5 |
$ |
4,435 |
$ |
578 |
$ |
5,013 |
$ |
5,013 |
$ |
(23 |
) |
$ |
325 |
||||||||||||||||||||||
2722 Fairview Street (OC Airport) |
116,575 |
58,802 |
— |
50% |
Y |
Y |
1Q-2018 |
4Q-2018 |
5 - 9 |
$ |
17,800 |
$ |
1,679 |
$ |
19,479 |
$ |
18,886 |
$ |
134 |
$ |
1,184 |
|||||||||||||||||||||||
1580 Carson Street (South Bay) |
43,787 |
43,787 |
— |
0% |
N |
N |
2Q-2018 |
4Q-2018 |
3 - 6 |
$ |
7,715 |
$ |
1,637 |
$ |
9,352 |
$ |
8,770 |
$ |
(17 |
) |
$ |
548 |
||||||||||||||||||||||
TOTAL/WEIGHTED AVERAGE |
400,936 |
170,273 |
— |
$ |
44,950 |
$ |
19,399 |
$ |
64,349 |
$ |
62,913 |
$ |
319 |
(12) |
$ |
4,509 |
||||||||||||||||||||||||||||
STABILIZED: |
||||||||||||||||||||||||||||||||||||||||||||
28903 Ave. Paine - Repo. (SF Valley) |
111,935 |
— |
— |
100% |
N |
Y |
-- |
-- |
-- |
$ |
11,545 |
$ |
4,339 |
$ |
15,884 |
$ |
15,832 |
$ |
(70 |
) |
(12) |
$ |
968 |
|||||||||||||||||||||
FUTURE REPOSITIONING: |
||||||||||||||||||||||||||||||||||||||||||||
16121 Carmenita Rd. (Mid-Counties) |
108,500 |
— |
— |
89% |
N |
N |
1Q-2019 |
3Q-2019 |
9 - 12 |
$ |
13,452 |
$ |
2,584 |
$ |
16,036 |
$ |
13,487 |
$ |
114 |
$ |
906 |
|||||||||||||||||||||||
(1) |
See page 27 for a definition of Properties and Space Under Repositioning. |
(2) |
Represents the estimated rentable square footage to be added upon completion of current development projects. |
(3) |
Represents the estimated remaining number of months, as of December 31, 2018, for the property to reach stabilization. Includes time to complete construction and lease-up the property. Actual number of months required to reach stabilization may vary materially from our estimates. See page 27 for a definition of Stabilization Date - Properties and Space Under Repositioning.
|
(4) |
Includes contractual purchase price plus closing costs. |
(5) |
Projected total investment includes the purchase price of the property and our current estimate of total expected nonrecurring capital expenditures to be incurred on each repositioning and development project to reach completion. We expect to update our estimates upon completion of the project, or sooner if there are any significant changes to expected costs from quarter to quarter. |
(6) |
Cumulative investment-to-date includes the purchase price of the property and subsequent costs incurred for nonrecurring capital expenditures. |
(7) |
Represents the actual cash NOI for each property for the three months ended December 31, 2018. For a definition/discussion of non-GAAP financial measures, see the definitions section beginning on pg. 25 of this report.
|
(8) |
Represents management’s estimate of each property’s annual cash NOI once the property has reached stabilization and initial rental concessions, if any, have elapsed. Actual results may vary materially from our estimates. |
(9) |
We expect to demolish the existing 49,976 RSF building and construct a new 89,270 RSF multi-unit building. |
(10) |
We acquired 1998 Surveyor Avenue as an under-construction building for a cost of $5.82 million and the assumption of the seller’s fixed-price construction contracts with $4.42 million of remaining costs. At completion, the property will consist of one 56,306 rentable square foot single-tenant building. As of December 31, 2018, the property was pre-leased and in January 2019 the tenant took possession of the property.
|
(11) |
9615 Norwalk is a 10.26 acre storage-yard with three buildings totaling 38,362 RSF. In January 2019, we converted the tenant’s MTM land lease to a term lease with an expiration date of June 30, 2020. We will demolish the existing buildings and construct a new 201,808 RSF building upon termination of the land lease. |
(12) |
Actual NOI for the three months ended December 31, 2018, reflects the capitalization of $132 thousand of real estate property taxes and insurance for current repositioning, $30 thousand for lease-up properties and $22 thousand for stabilized properties. We will continue to capitalize taxes and insurance during the period in which construction is taking place to get each repositioning property ready for its intended use.
|
|
Fourth Quarter 2018
Supplemental Financial Reporting Package
|
Page 20
|
|
|
Properties and Space Under Repositioning (Continued). (1)
| ||
As of December 31, 2018 |
(unaudited results, in thousands, except square feet) |
|
Repositioning Space | |||||||||||||||||||||||||||||||||
Same Property Portfolio |
Estimated Construction Period |
||||||||||||||||||||||||||||||||
Property (Submarket) |
Total Property Rentable Square Feet |
Space Under Repositioning/Lease-Up |
2018 |
2019 |
Start |
Target Completion |
Est. Period until Stabilized (months)(2) |
Projected Repositioning Cost(3)
|
Repositioning Costs Incurred to Date |
Total Property Leased % 12/31/18 |
Actual Quarterly Cash NOI 4Q-2018(4) |
Estimated Annual Stabilized Cash NOI(5) |
|||||||||||||||||||||
CURRENT REPOSITIONING: |
|||||||||||||||||||||||||||||||||
3233 Mission Oaks Blvd. - Unit 3233 (Ventura)(6)
|
461,210 |
109,129 |
Y |
Y |
2Q-2017 |
2Q-2019 |
9 - 15 |
$ |
8,175 |
$ |
5,344 |
73% |
$ |
(10 |
) |
(7) |
$ |
914 |
|||||||||||||||
FUTURE: |
|||||||||||||||||||||||||||||||||
7110 E. Rosecrans Avenue - Unit B (South Bay)(8)
|
73,439 |
— |
Y |
Y |
1Q-2019 |
2Q-2019 |
6 - 9 |
$ |
934 |
$ |
17 |
73% |
$ |
63 |
$ |
298 |
|||||||||||||||||
Stabilized Repositionings: Properties and Space | |||||||||||||||||||||||||||||||||
Property (Submarket) |
Rentable Square Feet |
Stabilized Period |
Stabilized Yield |
||||||||||||||||||||||||||||||
679-691 S. Anderson St. (Central LA) |
47,490 |
2Q-2017 |
6.3% |
||||||||||||||||||||||||||||||
18118 - 18120 S. Broadway St. (South Bay) |
18,033 |
2Q-2017 |
N/A(9)
|
||||||||||||||||||||||||||||||
3880 Valley Blvd. (San Gabriel Valley) |
108,550 |
3Q-2017 |
6.9% |
||||||||||||||||||||||||||||||
12131 Western Avenue (West OC) |
207,953 |
4Q-2017 |
5.9% |
||||||||||||||||||||||||||||||
228th Street (South Bay) |
23,453 |
4Q-2017 |
N/A(9)
|
||||||||||||||||||||||||||||||
3233 Mission Oaks Blvd. - Unit H (Ventura) |
43,927 |
1Q-2018 |
N/A(9)
|
||||||||||||||||||||||||||||||
1601 Alton Pkwy. (OC Airport) |
124,988 |
3Q-2018 |
5.6%(10)
|
||||||||||||||||||||||||||||||
301-445 Figueroa Street (South Bay) |
133,650 |
3Q-2018 |
7.8% |
||||||||||||||||||||||||||||||
28903 Ave. Paine - Repo. (SF Valley) |
111,935 |
4Q-2018 |
6.1% |
||||||||||||||||||||||||||||||
(1) |
See page 27 for a definition of Properties and Space Under Repositioning. |
(2) |
Represents the estimated remaining number of months, as of December 31, 2018, for the space to reach stabilization. Includes time to complete construction and lease-up the space. Actual number of months required to reach stabilization may vary materially from our estimates.
|
(3) |
Projected repositioning cost represents the estimated nonrecurring capital expenditures to be incurred for the repositioning to reach completion. Excludes historical cost of the land and building. We expect to update our estimates upon completion of the project, or sooner if there are any significant changes to expected costs from quarter to quarter. |
(4) |
Represents the actual cash NOI of repositioning space for the three months ended December 31, 2018. For a definition & discussion of non-GAAP financial measures, see the definitions section beginning on page 25.
|
(5) |
Based on management estimates of annual cash NOI for the repositioning space, once the property has reached stabilization and initial rental concessions, if any, have elapsed. Actual results may vary materially from our estimates. The Company does not provide a reconciliation to net income on a consolidated basis, because it is unable to provide a meaningful or accurate estimation of reconciling items due to the inherent difficulty of forecasting the timing and/or amount of various items that would impact net income. |
(6) |
As of December 31, 2018, we are repositioning space aggregating 109,129 RSF at 3233 Mission Oaks. The amounts presented on this page represent the actual and projected construction costs and the actual and estimated stabilized cash NOI of only the space under repositioning vs. the entire property.
|
(7) |
Actual NOI for the three months ended December 31, 2018, reflects the capitalization of $22 thousand of real estate property taxes and insurance for repositioning space. We will continue to capitalize real estate property taxes and insurance during the period in which construction is taking place to get each repositioning space ready for its intended use.
|
(8) |
We plan to reposition a 36,000 RSF unit at 7110 Rosecrans Avenue when the current lease expires in 1Q-2019. The amounts presented on this page represent the actual and projected construction costs and the actual and estimated stabilized cash NOI of only the space under repositioning vs. the entire property. |
(9) |
We are unable to provide a meaningful stabilized yield for these completed projects as these were partial repositionings of larger properties. |
(10) |
Represents the current yield based on 87% occupancy as of December 31, 2018, which is one year after the completion of repositioning construction work. Upon lease-up of the final unit, we project that the stabilized yield will be 7.4%.
|
|
Fourth Quarter 2018
Supplemental Financial Reporting Package
|
Page 21
|
|
|
Current Year Acquisitions and Dispositions Summary.
|
||
As of December 31, 2018 |
(unaudited results, data represents consolidated portfolio only) |
|
2018 Acquisitions | ||||||||||||||
Acquisition Date |
Property Address |
County |
Submarket |
Rentable Square Feet |
Acquisition Price ($ in MM) |
Occ. % at Acquisition |
Occ.% at Dec 31, 2018 |
|||||||
1/17/2018 |
13971 Norton Avenue |
San Bernardino |
Inland Empire West |
103,208 |
$11.36 |
100% |
100% |
|||||||
2/23/2018 |
1900 Proforma Avenue |
San Bernardino |
Inland Empire West |
135,360 |
$15.92 |
100% |
100% |
|||||||
2/23/2018 |
1910-1920 Archibald Avenue |
San Bernardino |
Inland Empire West |
78,243 |
$8.20 |
66% |
n/a(1)
|
|||||||
3/13/2018 |
16010 Shoemaker Avenue |
Los Angeles |
Mid-Counties |
115,600 |
$17.22 |
100% |
100% |
|||||||
4/4/2018 |
4039 Calle Platino |
San Diego |
North County San Diego |
143,274 |
$20.00 |
100% |
100% |
|||||||
4/5/2018 |
851 Lawrence Drive |
Ventura |
Ventura |
49,976 |
$6.60 |
—% |
—% |
|||||||
4/6/2018 |
1581 Main Street |
Orange |
North Orange County |
39,661 |
$7.15 |
100% |
100% |
|||||||
4/26/2018 |
660-664 Twin Oaks Valley Road |
San Diego |
North County San Diego |
96,993 |
$14.00 |
100% |
100% |
|||||||
4/26/2018 |
1580 Carson Street |
Los Angeles |
South Bay |
43,787 |
$7.50 |
—% |
—% |
|||||||
5/8/2018 |
1190 Stanford Court |
Orange |
North Orange County |
34,494 |
$6.08 |
100% |
100% |
|||||||
5/9/2018 |
5300 Sheila Street |
Los Angeles |
Central LA |
695,120 |
$121.00 |
100% |
100% |
|||||||
5/17/2018 |
15777 Gateway Circle |
Orange |
OC Airport |
37,592 |
$8.05 |
100% |
100% |
|||||||
5/18/2018 |
1998 Surveyor Avenue |
Ventura |
Ventura |
—(2)
|
$5.82(2)
|
—% |
—% |
|||||||
5/31/2018 |
3100 Fujita Street |
Los Angeles |
South Bay |
91,516 |
$14.04 |
100% |
100% |
|||||||
6/8/2018 |
4416 Azusa Canyon Road |
Los Angeles |
San Gabriel Valley |
70,510 |
$12.00 |
100% |
100% |
|||||||
6/12/2018 |
1420 Mckinley Avenue |
Los Angeles |
South Bay |
136,685 |
$30.00 |
—% |
100% |
|||||||
6/29/2018 |
12154 Montague Street |
Los Angeles |
Greater San Fernando Valley |
122,868 |
$22.53 |
100% |
100% |
|||||||
7/18/2018 |
10747 Norwalk Boulevard |
Los Angeles |
Mid-Counties |
52,691 |
$10.84 |
100% |
100% |
|||||||
7/19/2018 |
29003 Avenue Sherman |
Los Angeles |
Greater San Fernando Valley |
68,123 |
$9.50 |
—% |
—% |
|||||||
8/14/2018 |
16121 Carmenita Road |
Los Angeles |
Mid-Counties |
108,500 |
$13.30 |
89% |
89% |
|||||||
10/17/2018 |
1332-1340 Rocky Point Drive |
San Diego |
North County San Diego |
73,747 |
$10.17 |
31% |
31% |
|||||||
11/6/2018 |
6131-6133 Innovation Way |
San Diego |
North County San Diego |
114,572 |
$24.20 |
72% |
72% |
|||||||
11/8/2018 |
263-321 Gardena Boulevard |
Los Angeles |
South Bay |
55,238 |
$16.10 |
100% |
100% |
|||||||
11/30/2018 |
9200 Mason Avenue |
Los Angeles |
Greater San Fernando Valley |
80,410 |
$9.04 |
100% |
100% |
|||||||
11/30/2018 |
9230 Mason Avenue |
Los Angeles |
Greater San Fernando Valley |
54,000 |
$5.30 |
100% |
100% |
|||||||
11/30/2018 |
9250 Mason Avenue |
Los Angeles |
Greater San Fernando Valley |
56,292 |
$6.63 |
100% |
100% |
|||||||
11/30/2018 |
9171 Oso Avenue |
Los Angeles |
Greater San Fernando Valley |
65,560 |
$8.57 |
100% |
100% |
|||||||
11/30/2018 |
5593-5595 Fresca Drive |
Orange |
North Orange County |
115,200 |
$14.00 |
100% |
100% |
|||||||
12/7/2018 |
6100 Sheila Street |
Los Angeles |
Central LA |
74,527 |
$18.25 |
100% |
100% |
|||||||
12/28/2018 |
14421-14441 Bonelli Street |
Los Angeles |
San Gabriel Valley |
148,740 |
$19.50 |
100% |
100% |
|||||||
3,062,487 |
$492.87 |
|||||||||||||
2018 Dispositions | ||||||||||||||
Disposition Date |
Property Address |
County |
Submarket |
Rentable Square Feet |
Sale Price
($ in MM)
|
Reason for Selling |
||||||||
1/2/2018 |
8900–8980 Benson Ave. & 5637 Arrow Hwy. |
San Bernardino |
Inland Empire West |
88,016 |
$11.44 |
Opportunistic Sale |
||||||||
1/17/2018 |
700 Allen Avenue & 1851 Flower Street |
Los Angeles |
Greater San Fernando Valley |
25,168 |
$10.90 |
Opportunistic Sale |
||||||||
3/7/2018 |
200–220 South Grand Avenue |
Orange |
OC Airport |
27,200 |
$4.52 |
Opportunistic Sale |
||||||||
4/9/2018 |
6770 Central Avenue, Building B |
San Bernardino |
Inland Empire East |
11,808 |
$1.68 |
Opportunistic Sale |
||||||||
5/9/2018 |
1910-1920 Archibald Avenue |
San Bernardino |
Inland Empire West |
78,243 |
$9.05 |
Non-Core Asset |
||||||||
12/12/2018 |
311 East 157th Street |
Los Angeles |
South Bay |
12,000 |
$3.00 |
Opportunistic Sale |
||||||||
12/20/2018 |
329 East 157th Street |
Los Angeles |
South Bay |
12,000 |
$2.68 |
Opportunistic Sale |
||||||||
12/27/2018 |
319 East 157th Street |
Los Angeles |
South Bay |
24,000 |
$4.76 |
Opportunistic Sale |
||||||||
278,435 |
$48.03 |
|||||||||||||
(1) |
Property was sold on May 9, 2018. |
(2) |
We acquired 1998 Surveyor Avenue as an under-construction building for a cost of $5.82M and the assumption of the seller’s fixed-price construction contracts with approximately $4.42M of remaining costs. At completion, the property will be one single-tenant building containing 56,306 rentable square feet. |
|
Fourth Quarter 2018
Supplemental Financial Reporting Package
|
Page 22
|
|
|
Guidance.
|
||
As of December 31, 2018 |
||
2018 RESULTS AND 2019 OUTLOOK*
METRIC |
2018 |
2019 |
||||||
LATEST UPDATED GUIDANCE / ASSUMPTIONS |
YTD RESULTS AS OF
DECEMBER 31, 2018
|
GUIDANCE / ASSUMPTIONS |
2019 SAME PROPERTY DECEMBER 31, 2018 OCCUPANCY |
|||||
Net Income Attributable to Common Stockholders per diluted share (1)
|
$0.32 - $0.34 |
$0.41 |
$0.04 - $0.08 (2)
|
-- |
||||
Company share of Core FFO per diluted share (1)
|
$1.08 - $1.10 |
$1.12 |
$1.16 - $1.20 (2)
|
-- |
||||
Same Property Portfolio NOI Growth (3)
|
9.5% - 10.5% |
10.6% |
3.5% - 5.5% |
-- |
||||
Stabilized Same Property Portfolio NOI Growth (3)
|
7.0% - 8.0% |
7.4% |
3.0% - 3.5% |
-- |
||||
Year-End Same Property Portfolio Occupancy (3)
|
96.0% - 97.0% |
96.7% |
95.5% - 96.5% |
96.0% |
||||
Year-End Stabilized Same Property Portfolio Occupancy (3)
|
97.0% - 98.0% |
98.2% |
96.5% - 97.5% |
97.3% |
||||
General and Administrative Expenses (4)
|
$24.8M - $25.0M |
$25.2M
(incl. $1.0M cap lse costs $26.2M)
|
$29.0M - $30.0M |
-- |
||||
(1) |
Our 2019 Net income and Core FFO guidance refers to the Company's in-place portfolio as of February 12, 2019, and does not include any assumptions for acquisitions, dispositions or balance sheet activities that may or may not occur later during the year. The Company’s in-place portfolio as of February 12, 2019, reflects the acquisition of three properties containing 698,956 rentable square feet that occurred subsequent to December 31, 2018.
|
(2) |
See page 28 for a reconciliation of the Company’s 2019 guidance range of net income attributable to common stockholders per diluted share, the most directly comparable forward-looking GAAP financial measure, to Core FFO per diluted share. |
(3) |
Our 2019 Same Property Portfolio is a subset of our consolidated portfolio and consists of 147 properties aggregating 18,311,199 rentable square feet that were wholly-owned by us as of January 1, 2018, and still owned by us as of February 12, 2019. Our 2019 Stabilized Same Property Portfolio represents the properties included in our 2019 Same Property Portfolio, adjusted to exclude nine of our properties that were or will be in various stages of repositioning (current and future) or lease-up during 2018 and 2019. See page 27 for the definition of Stabilized Same Property Portfolio which includes a list of these nine properties.
|
(4) |
Our 2019 general and administrative expense guidance includes (i) estimated non-cash equity compensation expense of $10.2 million and (ii) estimated internal leasing costs of $1.3 million that will be expensed beginning January 1, 2019 when the new leasing standard (ASC 842) is adopted. During the year ended December 31, 2018, under the current leasing standard (ASC 840), we capitalized $1.0 million of internal leasing costs.
|
* A number of factors could impact the Company’s ability to deliver results in line with its guidance, including, but not limited to, interest rates, the economy, the supply and demand of industrial real estate, the availability and terms of financing to potential acquirers of real estate and the timing and yields for divestment and investment. There can be no assurance that the Company can achieve such results.
|
Fourth Quarter 2018
Supplemental Financial Reporting Package
|
Page 23
|
|
|
Net Asset Value Components.
|
||
At 12/31/2018 |
(unaudited and in thousands, except share data) |
|
Net Operating Income |
||
Pro Forma Net Operating Income (NOI)(1)
|
Three Months Ended December 31, 2018 |
|
Total operating revenues |
$56,125 |
|
Property operating expenses |
(13,642) |
|
Pro forma effect of uncommenced leases(2)
|
323 |
|
Pro forma effect of acquisitions(3)
|
1,005 |
|
Pro forma effect of dispositions(4)
|
(8) |
|
Pro forma NOI effect of properties and space under repositioning(5)
|
2,572 |
|
Pro Forma NOI |
46,375 |
|
Amortization of net below-market lease intangibles |
(1,627) |
|
Straight line rental revenue adjustment |
(1,492) |
|
Pro Forma Cash NOI |
$43,256 |
|
Balance Sheet Items |
||
Other assets and liabilities |
December 31, 2018 |
|
Cash and cash equivalents |
$180,601 |
|
Rents and other receivables, net |
4,944 |
|
Other assets |
6,723 |
|
Acquisition related deposits |
925 |
|
Accounts payable, accrued expenses and other liabilities |
(21,074) |
|
Dividends payable |
(15,938) |
|
Tenant security deposits |
(23,262) |
|
Prepaid rents |
(6,539) |
|
Estimated remaining cost to complete repositioning projects |
(43,228) |
|
Total other assets and liabilities |
$83,152 |
|
Debt and Shares Outstanding |
||
Total consolidated debt(6)
|
$761,116 |
|
Preferred stock - liquidation preference |
$165,000 |
|
Common shares outstanding(7)
|
96,610,106 |
|
Operating partnership units outstanding(8)
|
2,415,811 |
|
Total common shares and operating partnership units outstanding |
99,025,917 |
|
(1) |
For a definition and discussion of non-GAAP financial measures, see the notes and definitions section beginning on page 25 of this report.
|
(2) |
Represents the estimated incremental base rent from uncommenced new and renewal leases as if they had commenced as of October 1, 2018. |
(3) |
Represents the estimated incremental NOI from Q4'18 acquisitions as if they had been acquired on October 1, 2018. We have made a number of assumptions in such estimates and there can be no assurance that we would have generated the projected levels of NOI had we actually owned the acquired entities as of October 1, 2018.
|
(4) |
Represents the deduction of actual Q4'18 NOI for properties sold during the current quarter. See page 22 for a detail of current year disposition properties.
|
(5) |
Represents the estimated incremental NOI from the properties that were classified as current or future repositioning or lease-up during the three months ended December 31, 2018, assuming that all repositioning work had been completed and all of the properties/space were fully stabilized as of October 1, 2018. See pages 20-21 for the properties included. We have made a number of assumptions in such estimates and there can be no assurance that we would have generated the projected levels of NOI had these properties actually been stabilized as of October 1, 2018.
|
(6) |
Excludes unamortized loan discount and debt issuance costs totaling $3.7 million.
|
(7) |
Represents outstanding shares of common stock of the Company, which excludes 200,398 shares of unvested restricted stock.
|
(8) |
Represents outstanding common units of the Company’s operating partnership, Rexford Industrial Realty, L.P., that are owned by unit holders other than Rexford Industrial Realty, Inc. Includes 269,260 vested LTIP Units and excludes 327,048 unvested LTIP Units and 591,767 unvested performance units.
|
|
Fourth Quarter 2018
Supplemental Financial Reporting Package
|
Page 24
|
|
|
Notes and Definitions.
| ||
Adjusted Funds from Operations (“AFFO”): We calculate adjusted funds from operations, or AFFO, by adding to or subtracting from FFO, as defined below, the following items: (i) certain non-cash operating revenues and expenses, (ii) capitalized operating expenditures such as leasing and construction payroll, (iii) recurring capital expenditures required to maintain and re-tenant our properties, (iv) capitalized interest costs resulting from the repositioning/redevelopment of certain of our properties, (v) 2nd generation tenant improvements and leasing commissions and (vi) gain (loss) on extinguishment of debt. Management uses AFFO as a supplemental performance measure because it provides a performance measure that, when compared year over year, captures trends in portfolio operating results. We also believe that, as a widely recognized measure of the performance of REITs, AFFO will be used by investors as a basis to assess our performance in comparison to other REITs. However, because AFFO may exclude certain non-recurring capital expenditures and leasing costs, the utility of AFFO as a measure of our performance is limited. Additionally, other Equity REITs may not calculate AFFO using the method we do. As a result, our AFFO may not be comparable to such other Equity REITs’ AFFO. AFFO should be considered only as a supplement to net income (as computed in accordance with GAAP) as a measure of our performance.
In-Place Annualized Base Rent and Uncommenced Annualized Base Rent:
• |
In-Place Annualized Base Rent (“In-Place ABR”): Calculated as the monthly contractual base rent (before rent abatements) per the terms of the lease, as of December 31, 2018, multiplied by 12. Includes leases that have commenced as of December 31, 2018 or leases where tenant has taken early possession of space as of December 31, 2018. Excludes billboard and antenna revenue and tenant reimbursements.
|
• |
In-Place ABR per Square Foot: Calculated by dividing In-Place ABR for the lease by the occupied square feet of the lease, as of December 31, 2018.
|
• |
Combined In-Place and Uncommenced Annualized Base Rent (“In-Place + Uncommenced ABR”): Calculated by adding (i) In-Place ABR and (ii) ABR Under Uncommenced Leases (see definition below). Does not include adjustments for leases that expired and were not renewed subsequent to December 31, 2018, or adjustments for future known non-renewals.
|
• |
ABR Under Uncommenced Leases: Calculated by adding the following:
|
(i) ABR under Uncommenced New Leases = first full month of contractual base rents (before rent abatements) to be received under Uncommenced New Leases, multiplied by 12.
(ii) Incremental ABR under Uncommenced Renewal Leases = difference between: (a) the first full month of contractual base rents (before rent abatements) to be received under Uncommenced Renewal Leases and (b) the monthly In-Place ABR for the same space as of December 31, 2018, multiplied by 12.
• |
In-Place + Uncommenced ABR per Square Foot: Calculated by dividing (i) In-Place + Uncommenced ABR for the leases by (ii) the square footage under commenced and uncommenced leases (net of renewal space) as of December 31, 2018.
|
• |
Uncommenced New Leases: Reflects new leases (for vacant space) that have been signed but have not yet commenced as of December 31, 2018.
|
• |
Uncommenced Renewal Leases: Reflects renewal leases (for space occupied by renewing tenant) that have been signed but have not yet commenced as of December 31, 2018.
|
Capital Expenditures, Non-recurring: Expenditures made in respect of a property for improvement to the appearance of such property or any other major upgrade or renovation of such property, and further includes capital expenditures for seismic upgrades, and capital expenditures for deferred maintenance existing at the time such property was acquired.
Capital Expenditures, Recurring: Expenditures made in respect of a property for maintenance of such property and replacement of items due to ordinary wear and tear including, but not limited to, expenditures made for maintenance of parking lot, roofing materials, mechanical systems, HVAC systems and other structural systems. Recurring capital expenditures shall not include any of the following: (a) improvements to the appearance of such property or any other major upgrade or renovation of such property not necessary for proper maintenance or marketability of such property; (b) capital expenditures for seismic upgrades; (c) capital expenditures for deferred maintenance for such property existing at the time such property was acquired; or (d) replacements of either roof or parking lots.
Capital Expenditures, First Generation: Capital expenditures for newly acquired space, newly developed or redeveloped space, or change in use.
Cash NOI: Cash basis NOI is a non-GAAP measure, which we calculate by adding or subtracting from NOI (i) fair value lease revenue and (ii) straight-line rent adjustment. We use Cash NOI, together with NOI, as a supplemental performance measure. Cash NOI should not be used as a measure of our liquidity, nor is it indicative of funds available to fund our cash needs. Cash NOI should not be used as a substitute for cash flow from operating activities computed in accordance with GAAP. We use Cash NOI to help evaluate the performance of the Company as a whole, as well as the performance of our Same Property Portfolio.
Core Funds from Operations (“Core FFO”): We calculate Core FFO by adjusting FFO, as defined below, to exclude the impact of certain items that we do not consider reflective of our core revenue or expense streams. For the periods presented, Core FFO adjustments consisted of acquisition expenses. Management believes that Core FFO is a useful supplemental measure as it provides a more meaningful and consistent comparison of operating performance and allows investors to more easily compare the Company's operating results. Because these adjustments have a real economic impact on our financial condition and results from operations, the utility of Core FFO as a measure of our performance is limited. Other REITs may not calculate Core FFO in a consistent manner. Accordingly, our Core FFO may not be comparable to other REITs' core FFO. Core FFO should be considered only as a supplement to net income computed in accordance with GAAP as a measure of our performance.
|
Fourth Quarter 2018
Supplemental Financial Reporting Package
|
Page 25
|
|
|
Notes and Definitions.
| ||
Debt Covenants ($ in thousands):
Dec 31, 2018 |
Sep 30, 2018 |
||||||||
Current Period Covenant |
Credit Facility, $225M Term Loan and $150M Term Loan |
$100M Senior Notes and $125M Senior Notes |
Credit Facility, $225M Term Loan and $150M Term Loan |
$100M Senior Notes and $125M Senior Notes |
|||||
Maximum Leverage Ratio |
less than 60% |
25.6% |
25.6% |
26.7% |
26.7% |
||||
Maximum Secured Leverage Ratio |
less than 45% |
2.0% |
n/a |
2.1% |
n/a |
||||
Maximum Secured Leverage Ratio |
less than 40% |
n/a |
2.0% |
n/a |
2.1% |
||||
Maximum Secured Recourse Debt |
less than 15% |
—% |
—% |
—% |
—% |
||||
Minimum Tangible Net Worth |
$1,433,797 |
$2,129,053 |
$2,129,053 |
$1,993,805 |
$1,993,805 |
||||
Minimum Fixed Charge Coverage Ratio |
at least 1.50 to 1.00 |
4.4 to 1.00 |
4.4 to 1.00 |
4.1 to 1.00 |
4.1 to 1.00 |
||||
Unencumbered Leverage Ratio |
less than 60% |
26.5% |
26.5% |
28.0% |
28.0% |
||||
Unencumbered Interest Coverage Ratio |
at least 1.75 to 1.00 |
6.80 to 1.00 |
6.80 to 1.00 |
6.46 to 1.00 |
6.46 to 1.00 |
||||
Our actual performance for each covenant is calculated based on the definitions set forth in each loan agreement.
EBITDAre and Adjusted EBITDA: We calculate EBITDAre in accordance with the standards established by the National Association of Real Estate Investment Trusts (“NAREIT”). EBITDAre is calculated as net income (loss) (computed in accordance with GAAP), before interest expense, tax expense, depreciation and amortization, gains (or losses) from sales of depreciable operating property, impairment losses and adjustments to reflect our proportionate share of EBITDAre from our unconsolidated joint venture. We calculate Adjusted EBITDA by adding or subtracting from EBITDAre the following items: (i) non-cash stock based compensation expense, (ii) gain (loss) on extinguishment of debt, (iii) acquisition expenses and (iv) the pro-forma effects of acquisitions and dispositions. We believe that EBITDAre and Adjusted EBITDA are helpful to investors as a supplemental measure of our operating performance as a real estate company because it is a direct measure of the actual operating results of our industrial properties. We also use these measures in ratios to compare our performance to that of our industry peers. In addition, we believe EBITDAre and Adjusted EBITDA are frequently used by securities analysts, investors and other interested parties in the evaluation of Equity REITs. However, because EBITDAre and Adjusted EBITDA are calculated before recurring cash charges including interest expense and income taxes, and are not adjusted for capital expenditures or other recurring cash requirements of our business, their utility as a measure of our liquidity is limited. Accordingly, EBITDAre and Adjusted EBITDA should not be considered alternatives to cash flow from operating activities (as computed in accordance with GAAP) as a measure of our liquidity. EBITDAre and Adjusted EBITDA should not be considered as alternatives to net income or loss as an indicator of our operating performance. Other Equity REITs may calculate EBITDAre and Adjusted EBITDA differently than we do; accordingly, our EBITDAre and Adjusted EBITDA may not be comparable to such other Equity REITs’ EBITDAre and Adjusted EBITDA. EBITDAre and Adjusted EBITDA should be considered only as supplements to net income (as computed in accordance with GAAP) as a measure of our performance.
Fixed Charge Coverage Ratio:
For the Three Months Ended |
|||||||||||||||||||
Dec 31, 2018 |
Sep 30, 2018 |
Jun 30, 2018 |
Mar 31, 2018 |
Dec 31, 2017 |
|||||||||||||||
EBITDAre
|
$ |
36,903 |
$ |
35,565 |
$ |
32,438 |
$ |
30,405 |
$ |
28,184 |
|||||||||
Amortization of above/below market lease intangibles |
(1,627 |
) |
(1,622 |
) |
(1,616 |
) |
(1,116 |
) |
(1,067 |
) |
|||||||||
Non-cash stock compensation |
2,282 |
2,244 |
2,658 |
1,727 |
1,328 |
||||||||||||||
Straight line corporate office rent expense adjustment |
(47 |
) |
(43 |
) |
(34 |
) |
(41 |
) |
(30 |
) |
|||||||||
Gain on extinguishment of debt |
— |
— |
— |
— |
(47 |
) |
|||||||||||||
Straight line rental revenue adjustment |
(1,492 |
) |
(1,343 |
) |
(1,673 |
) |
(1,969 |
) |
(1,478 |
) |
|||||||||
Capitalized payments |
(1,104 |
) |
(1,027 |
) |
(927 |
) |
(881 |
) |
(1,026 |
) |
|||||||||
Recurring capital expenditures |
(2,403 |
) |
(1,405 |
) |
(959 |
) |
(854 |
) |
(826 |
) |
|||||||||
2nd generation tenant improvements and leasing commissions |
(1,252 |
) |
(966 |
) |
(795 |
) |
(983 |
) |
(1,480 |
) |
|||||||||
Cash flow for fixed charge coverage calculation |
31,260 |
31,403 |
29,092 |
26,288 |
23,558 |
||||||||||||||
Cash interest expense calculation detail: |
|||||||||||||||||||
Interest expense |
6,656 |
6,456 |
6,452 |
5,852 |
5,638 |
||||||||||||||
Capitalized interest |
469 |
650 |
563 |
371 |
384 |
||||||||||||||
Note payable premium amort. |
(1 |
) |
(1 |
) |
(2 |
) |
(1 |
) |
38 |
||||||||||
Amortization of deferred financing costs |
(345 |
) |
(344 |
) |
(332 |
) |
(311 |
) |
(294 |
) |
|||||||||
Cash interest expense |
6,779 |
6,761 |
6,681 |
5,911 |
5,766 |
||||||||||||||
Scheduled principal payments |
38 |
38 |
233 |
232 |
264 |
||||||||||||||
Preferred stock dividends |
2,424 |
2,423 |
2,424 |
2,423 |
1,909 |
||||||||||||||
Fixed charges |
$ |
9,241 |
$ |
9,222 |
$ |
9,338 |
$ |
8,566 |
$ |
7,939 |
|||||||||
Fixed Charge Coverage Ratio |
3.4 |
x |
3.4 |
x |
3.1 |
x |
3.1 |
x |
3.0 |
x |
|||||||||
Funds from Operations (“FFO”): We calculate FFO in accordance with the standards established by NAREIT. FFO represents net income (loss) (computed in accordance with GAAP), excluding gains (or losses) from sales of depreciable operating property, impairment losses, real estate related depreciation and amortization (excluding amortization of deferred financing costs) and after adjustments for unconsolidated partnerships and joint ventures. Management uses FFO as a supplemental performance measure because, in excluding real estate related depreciation and amortization, gains and losses from property dispositions, other than temporary impairments of unconsolidated real estate entities, and impairment on our investment in real estate, it provides a performance measure that, when compared year over year, captures trends in occupancy rates, rental rates and operating costs. We also believe that, as a widely recognized measure of performance used by other REITs, FFO may be used by investors
|
Fourth Quarter 2018
Supplemental Financial Reporting Package
|
Page 26
|
|
|
Notes and Definitions.
| ||
as a basis to compare our operating performance with that of other REITs. However, because FFO excludes depreciation and amortization and captures neither the changes in the value of our properties that result from use or market conditions nor the level of capital expenditures and leasing commissions necessary to maintain the operating performance of our properties, all of which have real economic effects and could materially impact our results from operations, the utility of FFO as a measure of our performance is limited. Other equity REITs may not calculate or interpret FFO in accordance with the NAREIT definition as we do, and, accordingly, our FFO may not be comparable to such other REITs’ FFO. FFO should not be used as a measure of our liquidity, and is not indicative of funds available for our cash needs, including our ability to pay dividends. FFO should be considered only as a supplement to net income computed in accordance with GAAP as a measure of our performance.
Net Operating Income (“NOI”): NOI is a non-GAAP measure which includes the revenue and expense directly attributable to our real estate properties. NOI is calculated as total revenue from real estate operations including i) rental income, ii) tenant reimbursements, and iii) other income less property expenses. We use NOI as a supplemental performance measure because, in excluding real estate depreciation and amortization expense, general and administrative expenses, interest expense, gains (or losses) on sale of real estate and other non-operating items, it provides a performance measure that, when compared year over year, captures trends in occupancy rates, rental rates and operating costs. We also believe that NOI will be useful to investors as a basis to compare our operating performance with that of other REITs. However, because NOI excludes depreciation and amortization expense and captures neither the changes in the value of our properties that result from use or market conditions, nor the level of capital expenditures and leasing commissions necessary to maintain the operating performance of our properties (all of which have real economic effect and could materially impact our results from operations), the utility of NOI as a measure of our performance is limited. Other equity REITs may not calculate NOI in a similar manner and, accordingly, our NOI may not be comparable to such other REITs’ NOI. Accordingly, NOI should be considered only as a supplement to net income as a measure of our performance. NOI should not be used as a measure of our liquidity, nor is it indicative of funds available to fund our cash needs. NOI should not be used as a substitute for cash flow from operating activities in accordance with GAAP. We use NOI to help evaluate the performance of the Company as a whole, as well as the performance of our Same Property Portfolio.
Proforma NOI: Proforma NOI is calculated by adding to NOI the following adjustments: (i) the estimated impact on NOI of uncommenced leases as if they had commenced at the beginning of the reportable period, (ii) the estimated impact on NOI of current period acquisitions as if they had been acquired at the beginning of the reportable period, (iii) the actual NOI of properties sold during the current period and (iv) the estimated incremental NOI from properties that were classified as repositioning/lease-up properties as of the end of the reporting period, assuming that all repositioning work had been completed and the properties/space were fully stabilized as of the beginning of the reportable period. These estimates do not purport to be indicative of what operating results would have been had the transactions actually occurred at the beginning of the reportable period and may not be indicative of future operating results.
Properties and Space Under Repositioning: Typically defined as properties or units where a significant amount of space is held vacant in order to implement capital improvements that improve the functionality (not including basic refurbishments, i.e., paint and carpet), cash flow and value of that space. We define a significant amount of space in a building as the lower of (i) 20,000 square feet of space or (ii) 50% of a building’s square footage. Typically, we would include properties or space where the repositioning and lease-up time frame is estimated to be greater than six months. A repositioning is considered complete once the investment is fully or nearly fully deployed and the property is marketable for leasing.
Rent Change - Cash: Compares the first month cash rent excluding any abatement on new leases to the last month rent for the most recent expiring lease. Data included for comparable leases only. Comparable leases generally exclude: (i) space that has never been occupied under our ownership, (ii) repositioned/redeveloped space, (iii) space that has been vacant for over one year, (iv) space with different lease structures (for example a change from a gross lease to a modified gross lease or an increase or decrease in the leased square footage) or (v) lease terms shorter than six months.
Rent Change - GAAP: Compares GAAP rent, which straightlines rental rate increases and abatements, on new leases to GAAP rent for the most recent expiring lease. Data included for comparable leases only. Comparable leases generally exclude: (i) space that has never been occupied under our ownership, (ii) repositioned/redeveloped space, (iii) space that has been vacant for over one year, (iv) space with different lease structures (for example a change from a gross lease to a modified gross lease or an increase or decrease in the leased square footage) or (v) lease terms shorter than six months.
Same Property Portfolio: Our Same Property Portfolio is a subset of our consolidated portfolio and includes properties that were wholly-owned by us as of January 1, 2017, and still owned by us as of December 31, 2018. The Company’s computation of same property performance may not be comparable to other REITs.
Stabilization Date - Properties and Space Under Repositioning: We consider a repositioning property to be stabilized at the earlier of the following: (i) upon reaching 90% occupancy or (ii) one year from the date of completion of repositioning construction work.
Stabilized Same Property Portfolio: Our Stabilized Same Property Portfolio represents the properties included in our Same Property Portfolio, adjusted to exclude the properties listed in the table below that were under repositioning/lease-up during comparable years. Stabilized Same Property Portfolio occupancy/leasing statistics exclude vacant/unleased repositioning space at each of these properties as of the end of each reporting period. Stabilized Same Property Portfolio NOI excludes the NOI for the entire property for all comparable periods.
Our 2018 Stabilized Same Property Portfolio excludes the following Same Property Portfolio properties aggregating 1,607,922 rentable square feet that were in various stages of repositioning or lease-up during 2017 and 2018:
12131 Western Avenue |
301-445 Figueroa Street |
|
14742-14750 Nelson Avenue |
3233 Mission Oaks Boulevard |
|
1601 Alton Parkway |
3880 Valley Boulevard |
|
18118-18120 Broadway Street |
679-691 South Anderson Street |
|
228th Street |
9615 Norwalk Boulevard |
|
2700-2722 Fairview Street |
||
|
Fourth Quarter 2018
Supplemental Financial Reporting Package
|
Page 27
|
|
|
Notes and Definitions.
| ||
Stabilized Same Property Portfolio (Continued): Our 2019 Stabilized Same Property Portfolio excludes the following Same Property Portfolio properties aggregating 1,300,733 rentable square feet that were or will be in various stages of repositioning or lease-up during 2018 and 2019:
14742-14750 Nelson Avenue |
301-445 Figueroa Street |
|
15401 Figueroa Street |
3233 Mission Oaks Boulevard |
|
1601 Alton Parkway |
7110 E. Rosecrans Avenue |
|
2700-2722 Fairview Street |
9615 Norwalk Boulevard |
|
28903 Avenue Paine |
||
Reconciliation of Net Income to NOI and Cash NOI (in thousands):
Three Months Ended |
|||||||||||||||||||
Dec 31, 2018 |
Sep 30, 2018 |
Jun 30, 2018 |
Mar 31, 2018 |
Dec 31, 2017 |
|||||||||||||||
Net Income |
$ |
15,207 |
$ |
8,965 |
$ |
7,819 |
$ |
15,084 |
$ |
14,115 |
|||||||||
Add: |
|||||||||||||||||||
General and administrative |
6,297 |
6,229 |
6,506 |
6,162 |
5,558 |
||||||||||||||
Depreciation and amortization |
20,671 |
20,144 |
19,775 |
19,452 |
18,767 |
||||||||||||||
Acquisition expenses |
166 |
106 |
37 |
9 |
33 |
||||||||||||||
Interest expense |
6,656 |
6,456 |
6,452 |
5,852 |
5,638 |
||||||||||||||
Subtract: |
|||||||||||||||||||
Management, leasing, and development services |
114 |
116 |
140 |
103 |
113 |
||||||||||||||
Interest income |
769 |
609 |
— |
— |
— |
||||||||||||||
Gain on extinguishment of debt |
— |
— |
— |
— |
47 |
||||||||||||||
Gains on sale of real estate |
5,631 |
— |
1,608 |
9,983 |
10,336 |
||||||||||||||
NOI |
$ |
42,483 |
$ |
41,175 |
$ |
38,841 |
$ |
36,473 |
$ |
33,615 |
|||||||||
Straight line rental revenue adjustment |
(1,492 |
) |
(1,343 |
) |
(1,673 |
) |
(1,969 |
) |
(1,478 |
) |
|||||||||
Amortization of above/below market lease intangibles |
(1,627 |
) |
(1,622 |
) |
(1,616 |
) |
(1,116 |
) |
(1,067 |
) |
|||||||||
Cash NOI |
$ |
39,364 |
$ |
38,210 |
$ |
35,552 |
$ |
33,388 |
$ |
31,070 |
|||||||||
Reconciliation of Net Income to Same Property Portfolio NOI and Same Property Portfolio Cash NOI (in thousands):
Three Months Ended December 31, |
Year Ended December 31, |
||||||||||||||
2018 |
2017 |
2018 |
2017 |
||||||||||||
Net income |
$ |
15,207 |
$ |
14,115 |
$ |
47,075 |
$ |
41,700 |
|||||||
Add: |
|||||||||||||||
General and administrative |
6,297 |
5,558 |
25,194 |
21,610 |
|||||||||||
Depreciation and amortization |
20,671 |
18,767 |
80,042 |
64,852 |
|||||||||||
Acquisition expenses |
166 |
33 |
318 |
454 |
|||||||||||
Interest expense |
6,656 |
5,638 |
25,416 |
20,209 |
|||||||||||
Deduct: |
|||||||||||||||
Management, leasing and development services |
114 |
113 |
473 |
493 |
|||||||||||
Interest income |
769 |
— |
1,378 |
445 |
|||||||||||
Equity in income from unconsolidated real estate entities |
— |
— |
— |
11 |
|||||||||||
Gain on extinguishment of debt |
— |
47 |
— |
25 |
|||||||||||
Gains on sale of real estate |
5,631 |
10,336 |
17,222 |
29,573 |
|||||||||||
NOI |
$ |
42,483 |
$ |
33,615 |
$ |
158,972 |
$ |
118,278 |
|||||||
Non-Same Property Portfolio operating revenues |
(17,876 |
) |
(10,343 |
) |
(61,000 |
) |
(23,045 |
) |
|||||||
Non-Same Property Portfolio property expenses |
4,196 |
2,997 |
15,026 |
6,901 |
|||||||||||
Same Property Portfolio NOI |
$ |
28,803 |
$ |
26,269 |
$ |
112,998 |
$ |
102,134 |
|||||||
Straight line rental revenue adjustment |
(593 |
) |
(1,146 |
) |
(3,395 |
) |
(3,807 |
) |
|||||||
Amortization of above/below market lease intangibles |
(147 |
) |
(147 |
) |
(537 |
) |
(539 |
) |
|||||||
Same Property Portfolio Cash NOI |
$ |
28,063 |
$ |
24,976 |
$ |
109,066 |
$ |
97,788 |
|||||||
Reconciliation of Net Income Attributable to Common Stockholders per Diluted Share Guidance to Company share of Core FFO per Diluted Share Guidance:
2019 Estimate |
|||||||
Low |
High |
||||||
Net income attributable to common stockholders |
$ |
0.04 |
$ |
0.08 |
|||
Company share of depreciation and amortization |
$ |
1.12 |
$ |
1.12 |
|||
Company share of Core FFO |
$ |
1.16 |
$ |
1.20 |
|||
|
Fourth Quarter 2018
Supplemental Financial Reporting Package
|
Page 28
|
|
|